Report of the National Advisory (Kerner Report 1967)

The progress from Western colonial global expansion, and the construction of American wealth and industry on the backs of enslaved Blacks and Native peoples, followed by the abrupt "emancipation" of the slaves and their exodus from the South to the Northern cities, has led us to our current divided society. Divided by economic inequities and unequal access to social resources, the nation lives in a media dream of social harmony, or did until YouTube set its bed on fire. Now, it is common knowledge that our current system of brutal racist policing and punitive over-incarceration serves the dual purpose of maintaining racial prejudice and the inequities it justifies. Brief yourself on this late-breaking development in American history here.

Re: Report of the National Advisory (Kerner Report 1967)

Postby admin » Mon May 02, 2016 9:17 am

Part 1 of 5

Chapter 2: Patterns of Disorder [i]

INTRODUCTION

The President asked the Commission to answer several specific questions about the nature of riots:

• The kinds of communities where they occurred;
• The characteristics -- including age, education, and job history -- of those who rioted and those who did not;
• The ways in which groups of lawful citizens can be encouraged to help cool the situation;
• The relative impact of various depressed conditions in the ghetto which stimulated people to riot;
• The impact of federal and other programs on those conditions;
• The effect on rioting of police-community relationships;
• The parts of the community which suffered the most as a result of the disorders.

The profiles in the foregoing chapter portray the nature and extent of 10 of the disorders which took place during the summer of 1967. This chapter seeks in these events and in the others which we surveyed a set of common elements -- to aid in understanding what happened and in answering the President's questions.

This chapter also considers certain popular conceptions about riots. Disorders are often discussed as if there were a single type. The "typical" riot of recent years is sometimes seen as a massive uprising against white people, involving widespread burning, looting, and sniping, either by all Negroes or by an uneducated, Southern-born Negro underclass of habitual criminals or "riffraff." An agitator at a protest demonstration. the coverage of events by the news media, or an isolated ''triggering'' or "precipitating" incident is often identified as the primary spark of violence. A uniform set of stages is sometimes posited, with a succession of confrontations and withdrawals by two cohesive groups, the police on one side and a riotous mob on the other. Often it is assumed that there was no effort within the Negro community to reduce the violence. Sometimes the only remedy prescribed is application of the largest possible police or control force, as early as possible.

What we have found does not validate these conceptions. We have been unable to identify constant patterns in all aspects of civil disorders. We have found that they are unusual, irregular, complex and, in the present state of knowledge, unpredictable social processes. Like most human events, they do not unfold in orderly sequences.

Moreover, we have examined the 1967 disorders within a few months after their occurrence and under pressing time limitations. While we have collected information of considerable immediacy, analysis will undoubtedly improve with the passage and perspective of time and with the further accumulation and refinement of data. To facilitate further analysis we have appended much of our data to this report.

We have categorized the information now available about the 1967 disorders as follows.

• The pattern of violence over the nation: severity, location, timing, and numbers of people involved;
• The riot process in a sample of 24 disorders we have surveyed: [ii] prior events, the development of violence, the various control efforts on the part of officials and the community, and the relationship between violence and control efforts;
• The riot participants: a comparison of rioters with those who sought to limit the disorder and those who remained uninvolved;
• The setting in which the disorders occurred: social and economic conditions, local governmental structure, the scale of federal programs, and the grievance network in the Negro community;
• The aftermath of disorder: the ways in which communities responded after order was restored in the streets.

Based upon information derived from our surveys, we offer the following generalizations:

1. No civil disorder was "typical" in all respects. Viewed in a national framework, the disorders of 1967 varied greatly in terms of violence and damage: while a relatively small number were major under our criteria and a somewhat larger number were serious, most of the disorders would have received little or no national attention as "riots" had the nation not been sensitized by the more serious outbreaks.

2. While the civil disorders of 1967 were racial in character, they were not interracial. The 1967 disorders, as well as earlier disorders of the recent period, involved action within Negro neighborhoods against symbols of white American society -- authority and property -- rather than against white persons.

3. Despite extremist rhetoric, there was no attempt to subvert the social order of the United States. Instead, most of those who attacked white authority and property seemed to be demanding fuller participation in the social order and the material benefits enjoyed by the vast majority of American citizens.

4. Disorder did not typically erupt without preexisting causes, as a result of a single "triggering" or "precipitating" incident. Instead, it developed out of an increasingly disturbed social atmosphere, in which typically a series of tension-heightening incidents over a period of weeks or months became linked in the minds of many in the Negro community with a shared network of underlying grievances.

5. There was, typically, a complex relationship between the series of incidents and the underlying grievances. For example, grievances about allegedly abusive police practices, unemployment and underemployment, housing and other conditions in the ghetto, were often aggravated in the minds of many Negroes by incidents involving the police, or the inaction of municipal authorities on Negro complaints about police action, unemployment, inadequate housing or other conditions. When grievance-related incidents recurred and rising tensions were not satisfactorily resolved, a cumulative process took place in which prior incidents were readily recalled and grievances reinforced. At some point in the mounting tension, a further incident- -- n itself often routine or even trivial -- became the breaking point, and tension spilled into violence.

6. Many grievances in the Negro community result from the discrimination, prejudice and powerlessness which Negroes often experience. They also result from the severely disadvantaged social and economic conditions of many Negros as compared with those of whites in the same city and, more particularly, in the predominantly white suburbs.

7. Characteristically, the typical rioter was not a hoodlum, habitual criminal, or riffraff; nor was he a recent migrant, a member of an uneducated underclass, or a person lacking broad social and political concerns. Instead, he was a teenager or young adult, a lifelong resident of the city in which he rioted, a high-school drop-out -- but somewhat better educated than his Negro neighbor -- and almost invariably underemployed or employed in a menial job. He was proud of his race, extremely hostile to both whites and middle-class Negroes and, though informed about politics, highly distrustful of the political system and of political leaders.

8. Numerous Negro counter-rioters walked the streets urging rioters to "cool it." The typical counter-rioter resembled in many respects the majority of Negroes, who neither rioted nor took action against the rioters, that is, the non-involved. But certain differences are crucial: the counter-rioter as better educated and had higher income than either the rioter or the noninvolved.

9. Negotiations between Negroes and white officials occurred during virtually all the disorders surveyed. The negotiations often involved young, militant Negroes as well as older, established leaders. Despite a setting of chaos and disorder, negotiations in many cases involved discussion of underlying grievances as well as the handling of the disorder by control authorities.

10. The chain we have identified -- discrimination, prejudice, disadvantaged conditions, intense and pervasive grievances, a series of tension-heightening incidents, all culminating in the eruption of disorder at the hands of youthful, politically-aware activists -- must be understood as describing the central trend in the disorders, not as an explanation of all aspects of the riots or of all rioters. Some rioters, for example, may have shared neither the conditions nor the grievances of their Negro neighbors; some may have coolly and deliberately exploited the chaos created by others; some may have been drawn into the melee merely because they identified with, or wished to emulate, others. Nor do we intend to suggest that the majority of the rioters, who shared the adverse conditions and grievances, necessarily articulated in their own minds the connection between that background and their actions.

11. The background of disorder in the riot cities was typically characterized by severely disadvantaged conditions for Negroes, especially as compared with those for whites; a local government often unresponsive to these conditions; federal programs which had not yet reached a significantly large proportion of those in need; and the resulting reservoir of pervasive and deep grievance and frustration in the ghetto.

12. In the immediate aftermath of disorder, the status quo of daily life before the disorder generally was quickly restored. Yet, despite some notable public and private efforts, little basic change took place in the conditions underlying the disorder. In some cases, the result was increased distrust between blacks and whites, diminished interracial communication, and growth of Negro and white extremist groups.

I. THE PATTERN OF VIOLENCE AND DAMAGE

Levels of Violence and Damage


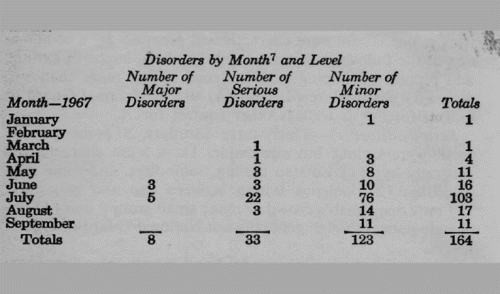
Because definitions of "civil disorder" vary widely, between 51 and 217 disorders were recorded by various agencies as having occurred during the first nine months of 1967. From these sources we have developed a list of 164 disorders which occurred during that period. [1] We have ranked them in three categories of violence and damage utilizing such criteria as the degree and duration of violence, the number of active participants, and the level of law enforcement response:

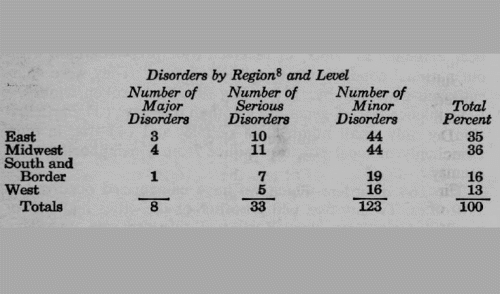
Major Disorders -- Eight disorders, 5 percent of the total, were major. These were characterized generally by a combination of the following factors: (1) many fires, intensive looting, and reports of sniping; (2) violence lasting more than two days; (3) sizeable crowds; and (4) use of National Guard or federal forces [2] as well as other control forces.

Serious disorders -- Thirty-three disorders, 20 percent of the total, were serious but not major. These were characterized generally by: (1) isolated looting, some fires, and some rock throwing; (2) violence lasting between one and two days; (3) only one sizeable crowd or many small groups; and (4) use of state police [3] though generally not National Guard or federal forces.

Minor disorders -- One hundred and twenty-three disorders, 75 percent of the total, were minor. These would not have been classified as "riots" or received wide press attention without national conditioning to a "riot climate." They were characterized generally by: (1) a few fires and broken windows; (2) violence lasting generally less than one day; (3) participation by only small numbers of people; and (4) use, in most cases, only of local police or police from a neighboring community. [4]

The 164 disorders which we have categorized occurred in 128 cities. Twenty-five (20 percent) of the cities had two or more disturbances. New York had five separate disorders, Chicago had four, six cities had three and 17 cities had two. [5] Two cities which experienced a major disorder -- Cincinnati and Tampa -- had subsequent disorders; Cincinnati had two more. However, in these two cities the later disorders were less serious than the earlier ones. In only two cities were later disorders more severe.

Three conclusions emerge from the data:

• The significance of the 1967 disorders cannot be minimized. The level of disorder was major or serious, in terms of our criteria, on 41 occasions in 39 cities.
• The level of disorder, however, has been exaggerated. Three-fourths of the disorders were relatively minor and would not have been regarded as nationally-newsworthy "riots" in prior years.
• The fact that a city had experienced disorder earlier in 1967 did not immunize it from further violence.

Time -- In 1967, disorders occurred with increasing frequency as summer approached and tapered off as it waned. More than 60 percent of the 164 disorders occurred in July alone.

Disorders by Month [7] and Level
Image

Space -- The violence was not limited to any one section of the country.

Disorders by Month [8] and Level
Image

When timing and location are considered together, other relationships appear. Ninety-eight disorders can be grouped into 23 clusters, which consist of two or more disturbances occurring within two weeks and within a few hundred miles of each other.

"Clustering" was particularly striking for two sets of cities. The first, centered on Newark, consisted of disorders in 14 New Jersey cities. The second, centered on Detroit, consisted of disturbances in seven cities in Michigan and one in Ohio. [9]

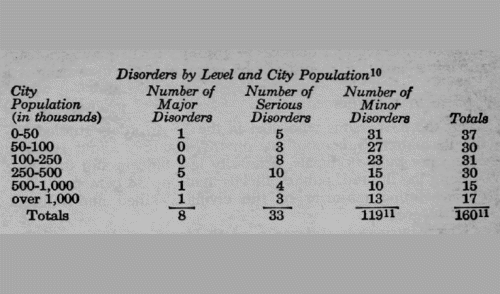
Size of Community -- The violence was not limited to large cities. Seven of the eight major disorders occurred in communities with populations of 250,000 or more. But 37 (23 percent) of the disorders reviewed occurred in communities with populations of 50,000 or less; and 67 disorders (41 percent) occurred in communities with populations of 100,000 or less, including nine (about 22 percent) of the 41 serious or major disturbances.

Disorders by Level and City Population [10]
Image

Death, Injury and Damage

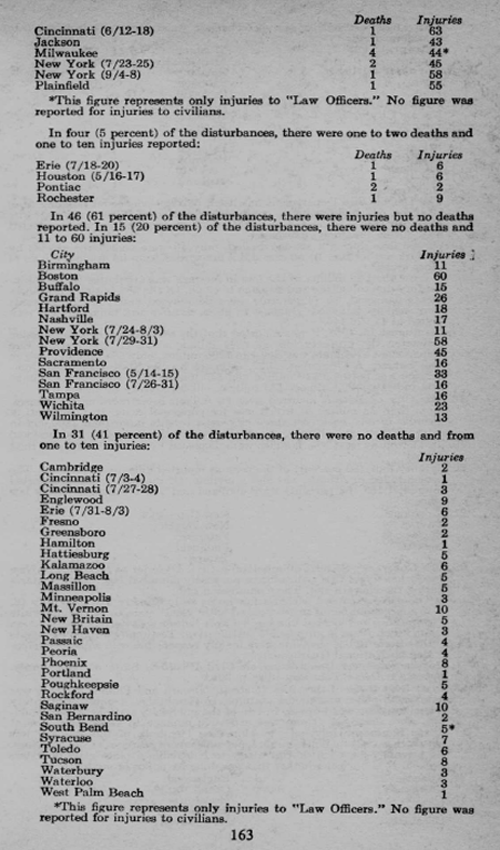
In its study of 75 disturbances in 67 cities, the Permanent Subcommittee on Investigations of the Senate Committee on Government Operations reported 83 deaths and 1,897 injuries. [12 ]Deaths occurred in 12 of these disturbances. More than 80 percent of the deaths and more than half the injuries occurred in Newark and Detroit. In more than 60 percent of the disturbances, no deaths and no more than 10 injuries were reported. [13]

Substantial damage to property also tended to be concentrated in a relatively small number of cities. Of the disorders which the Commission surveyed, significant damage resulted in Detroit ($40-45 million), Newark ($10.2 million), and Cincinnati (more than $1 million). In each of nine cities, damage was estimated at less than $100,000. [14]

Fire caused extensive damage in Detroit and Cincinnati, two of the three cities which suffered the greatest destruction of property. [15] Newark had relatively little loss from fire but extensive inventory loss from looting and damage to stock. [16]

Damage estimates made at the time of the Newark and Detroit disorders were later greatly reduced. Early estimates in Newark ranged from $15 to $25 million; a month later the estimate was revised to $10.2 million. In Detroit, newspaper damage estimates at first ranged from $200 million to $500 million, the highest recent estimate is $45 million. [17]

What we have said should not obscure three important factors. First, the dollar cost of the disorder should be increased by the extraordinary administrative expenses of municipal, state and Federal governments. [18 ]Second, deaths and injuries are not the sole measures of the cost of civil disorders in human terms. For example, the cost of dislocation of people -- though clearly not quantifiable in dollars and cents -- was a significant factor in Detroit, the one case in which many residences were destroyed. [19] Other human costs -- fear, distrust, and alienation -- were incurred in every disorder. Third, even a relatively low level of violence and damage in absolute terms may seriously disrupt a small or medium-sized community.

Victims of Violence

Of the 83 persons who died in the 75 disorders studied by the Permanent Subcommittee on Investigation, about 10 percent were public officials, primarily law officers and firemen. Among the injured, public officials made up 38 percent. [20] The overwhelming majority of the civilians killed and injured were Negroes.

Retail businesses suffered a much larger proportion of the damage during the disorders than public institutions, industrial properties, or private residences. In Newark, 1,029 establishments, affecting some 4,492 employers and employees, suffered damage to buildings or loss of inventory or both. Those which suffered the greatest loss through looting, in descending order of loss, were liquor, clothing, and furniture stores.

White-owned businesses are widely believed to have been damaged much more frequently than those owned by Negroes. In at least nine of the cities studied, the damage seems to have been, at least in part, the result of deliberate attacks on white-owned businesses characterized in the Negro community as unfair or disrespectful toward Negroes. [21]

Not all the listed damage was purposeful or was caused by rioters. Some was a by-product of violence. In certain instances police and fire department control efforts caused damage. The New Jersey commission on civil disorders has found that in Newark, retributive action was taken against Negro-owned property by control forces. [22] Some damage was accidental. In Detroit some fire damage, especially to residences, may have been caused primarily by a heavy wind.

Public institutions generally were not targets of serious attacks, [23] but police and fire equipment was damaged in at least 15 of the 23 cities. [24]

Of the cities surveyed, significant damage to residences occurred only in Detroit. In at least nine of the 22 other cities there was minor damage to residences, often resulting from fires in adjacent businesses. [25]

II. THE RIOT PROCESS

The Commission has found no "typical" disorder in 1967 in terms of intensity of violence and extensiveness of damage. To determine whether, as is sometimes suggested, there was a typical "riot process," we examined 24 disorders which occurred during 1967 in 20 cities and three university settings. [26] We have concentrated on four aspects of that process:

• The accumulating reservoir of grievances in the Negro community;
• "Precipitating" incidents and their relationship to the reservoir of grievances;
• The development of violence after its initial outbreak;
• The control effort, including official force, negotiation, and persuasion.

We found a common social process operating in all 24 disorders in certain critical respects. These events developed similarly, over a period of time and out of an accumulation of grievances and increasing tension in the Negro community. Almost invariably, they exploded in ways related to the local community and its particular problems and conflicts. But once violence erupted, there began a complex interaction of many elements -- rioters, official control forces, counter-rioters -- in which the differences between various disorders were more pronounced than the similarities.

The Reservoir of Grievances in the Negro Community

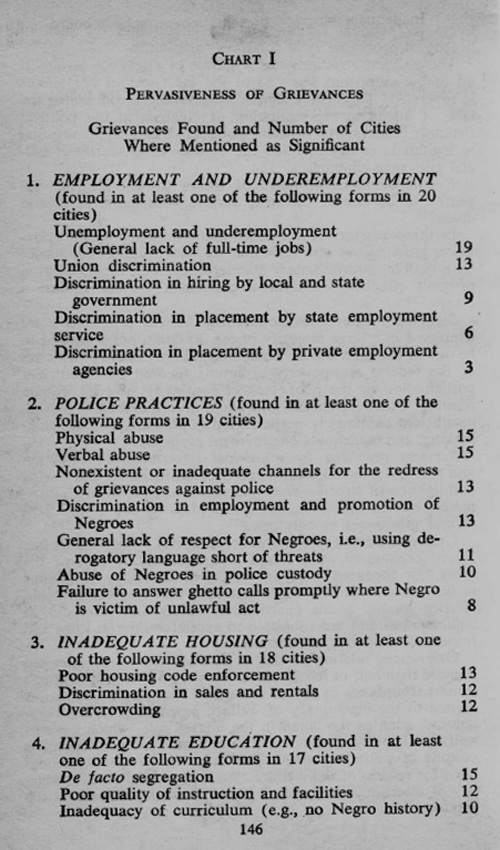
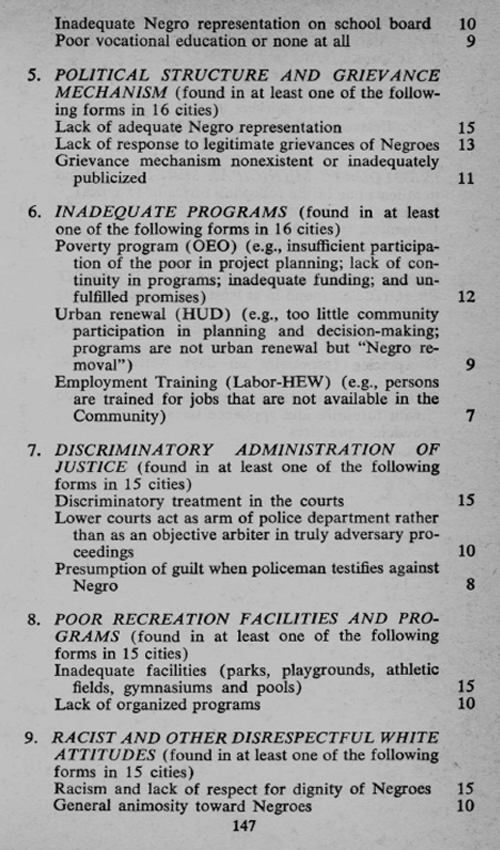
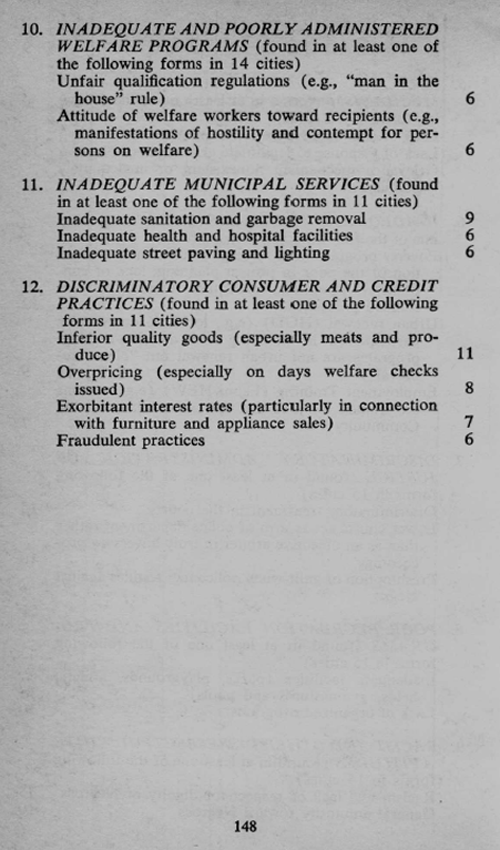
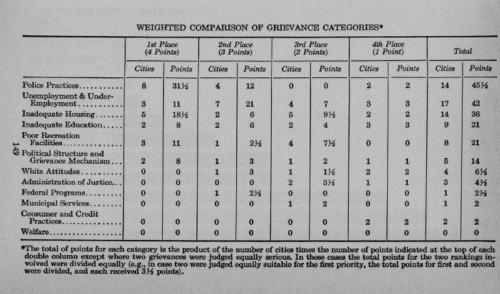
Our examination of the background of the surveyed disorders revealed a typical pattern of deeply-held grievances which were widely shared by many members of the Negro community. [27] The specific content of the expressed grievances varied somewhat from city to city. But in general, grievances among Negroes in all the cities related to prejudice, discrimination, severely disadvantaged living conditions and a general sense of frustration about their inability to change those conditions.

Specific events or incidents exemplified and reinforced the shared sense of grievance. News of such incidents spread quickly throughout the community and added to the reservoir. Grievances about police practices, unemployment and underemployment, housing and other objective conditions in the ghetto were aggravated in the minds of many Negroes by the inaction of municipal authorities.

Out of this reservoir of grievance and frustration, the riot process began in the cities which we surveyed.

Precipitating Incidents

In virtually every case a single "triggering" or "precipitating" incident can be identified as having immediately preceded -- within a few hours and in generally the same location -- the outbreak of disorder. [28] But this incident was usually relatively minor, even trivial, by itself substantially disproportionate to the scale of violence that followed. Often it was an incident of a type which had occurred frequently in the same community in the past without provoking violence.

We found that violence was generated by an increasingly disturbed social atmosphere, in which typically not one, but a series of incidents occurred over a period of weeks or months prior to the outbreak. of disorders. [29] Most cities had three or more such incidents; Houston had 10 over a five-month period. These earlier or prior incidents were linked in the minds of many Negroes to the pre-existing reservoir of underlying grievances. With each such incident, frustration and tension grew until at some point a final incident, often similar to the incidents preceding it, occurred and was followed almost immediately by violence.

As we see it, the prior incidents and the reservoir of underlying grievances contributed to a cumulative process of mounting tension that spilled over into violence when the final incident occurred. In this sense the entire chain -- the grievances, the series of prior tension-heightening incidents, and the final incident -- was the "precipitant" of disorder.

This chain describes the central trend in the disorders we surveyed, and not necessarily all aspects of the riots or of all rioters. For example, incidents have not always increased tension; and tension has not always resulted in violence. We conclude only that both processes did occur in the disorders we examined.

Similarly, we do not suggest that all rioters shared the conditions or the grievances of their Negro neighbors: some may deliberately have exploited the chaos created out of the frustration of others; some may have been drawn into the melee merely because they identified with, or wished to emulate, others. Some who shared the adverse conditions and grievances did not riot.

We found that the majority of the rioters did share the adverse conditions and grievances. Although they did not necessarily articulate in their own minds the connection between that background and their actions.

Newark and Detroit presented typical sequences of prior incidents, a build-up of tensions, a final incident, and the outbreak. of violence:

NEWARK

Prior Incidents


1965: A Newark policeman shot and killed an 18-year-old Negro boy. After the policeman had stated that he had fallen and his gun had discharged accidentally, he later claimed that the youth had assaulted another officer and was shot as he fled. At a hearing it was decided that the patrolman had not used excessive force. The patrolman remained on duty, and his occasional assignment to Negro areas was a continuing source of irritation in the Negro community:

April, 1967: Approximately 15 Negroes were arrested while picketing a grocery store which they claimed sold bad meat and used unfair credit practices.

Late May, early June: Negro leaders had for several months voiced strong opposition to a proposed medical-dental center to be built on 150 acres of land in the predominantly Negro Central Ward. The dispute centered mainly around the lack of relocation provisions for those who would be displaced by the medical center. The issue became extremely volatile in late May when public "blight hearings" were held regarding the land to be condemned: The hearings became a public forum in which many residents spoke against the proposed center. The city did not change its plan.

Late May, June: The mayor recommended appointment of a white city councilman who had no more than a high school education to the position of secretary to the board of education. Reportedly, there was widespread support from both whites and Negroes for a Negro candidate who held a master's degree and was considered more qualified. The mayor did not change his recommendation. Ultimately, the original secretary retained his position and neither candidate was appointed.

July 8: Several Newark policemen, allegedly including the patrolman involved in the 1965 killing, entered East Orange to assist the East Orange police during an altercation with a group of Negro men.

Final Incident

July 12, approximately 9:30 p.m.: A Negro cab driver was injured during or after a traffic arrest in the heart of the Central Ward. Word spread quickly, and a crowd gathered in front of the Fourth Precinct station-house across the street from a large public housing project.

Initial Violence

Same day, approximately 11:30 p.m.: The crowd continued to grow until it reached 300 to 500 people. One or two Molotov cocktails were thrown at the station-house. Shortly after midnight the police dispersed the crowd, and window-breaking and looting began a few minutes later. By about 1:00 a.m., the peak level of violence for the first night was reached.

DETROIT

Prior Incidents


August 1966: A crowd formed during a routine arrest of several Negro youths in the Kercheval section of the city. Tensions were high for several hours, but no serious violence occurred.

June 1967: A Negro prostitute was shot to death on her front steps. Rumors in the Negro community attributed the killing to a vice squad officer. A police investigation later reportedly unearthed leads to a disgruntled pimp. No arrests were made.

June 26: A young Negro man on a picnic was shot to death while reportedly trying to protect his pregnant wife from assault by seven white youths. The wife witnessed the slaying and miscarried shortly thereafter. Of the white youths, only one was charged. The others were released.

Final Incident

July 23, approximately 3:45 a.m.: Police raided a "blind pig," a type of night club in the Negro area which served drinks after hours. Eighty persons were in the club -- more than the police had anticipated -- attending a party for several servicemen, two of whom had recently returned from Vietnam. A crowd of about 200 persons gathered as the police escorted the patrons into the police wagons.

Initial Violence

Approximately 5:00 a.m.: As the last police cars drove away from the "blind pig," the crowd began to throw rocks. By 8:00 a.m., looting had become widespread. Violence continued to increase throughout the day, and by evening reached a peak level for the first day.

In the 24 disorders surveyed, the events identified as tension-heightening incidents, whether prior or final, involved issues which generally paralleled the grievances we found in these cities. [30] The incidents identified were of the following types:

Some 40 percent of the prior incidents involved allegedly abusive or discriminatory police actions. [31] Most of the police incidents began routinely and involved a response to, at most, a few persons rather than a large group. [32]

A typical incident occurred in Bridgeton, New Jersey five days before the disturbance when two police officers went to the home of a young Negro man to investigate a nonsupport complaint. A fight ensued when the officers attempted to take the man to the police station, and the Negro was critically injured and partially paralyzed. A Negro minister representing the injured man's family asked for suspension of the two officers involved pending investigation. This procedure had been followed previously when three policemen were accused of collusion in the robbery of a white-owned store. The Negro's request was not granted.

Police actions were also identified as the final incident preceding 12 of the 24 disturbances. [33] Again, in all but two cases, the police action which became the final incident began routinely. [34]

The final incident in Grand Rapids occurred when police attempted to apprehend a Negro driving an allegedly stolen car. A crowd of 30 to 40 Negro spectators gathered. The suspect had one arm in a cast, and some of the younger Negroes in the crowd intervened because they thought the police were handling him too roughly.

PROTEST ACTIVITIES

Approximately 22 percent of the prior incidents involved Negro demonstrations, rallies, and protest meetings. [35] Only five involved appearances by nationally-known Negro militants. [36]

Protest rallies and meetings were also identified as the final incident preceding five disturbances. Nationally-known Negro militants spoke at two of these meetings; in the other three only local leaders were involved. [37] A prior incident involving alleged police brutality was the principal subject of each of these three rallies. [38] Inaction of municipal authorities was the topic for two other meetings. [39]

WHITE RACIST ACTIVITIES

About 17 percent of the prior incidents involved activities by whites intended to discredit or intimidate Negroes, or violence by whites against Negroes. [40] These included some 15 cross-burnings in Bridgeton, the harassment of Negro college students by white teenagers in Jackson, Mississippi, and, in Detroit, the slaying of a Negro by a group of white youths. No final incidents were classifiable as racist activity.

PREVIOUS DISORDERS IN THE SAME CITY

In this category were approximately 16 percent of the prior incidents, including seven previous disorders, the handling of which had produced a continuing sense of grievance. [41] There were other incidents, usually of minor violence, which occurred prior to seven disorders [42] and were seen by the Negro community as precursors of the subsequent disturbance. Typically, in Plainfield the night before the July disorder, a Negro youth was injured in an altercation between white and Negro teenagers. Tensions rose as a result. No final incidents were identified in this category.

DISORDERS IN OTHER CITIES

Local media coverage and rumors generated by disorders in other cities were specifically identified as prior incidents in four cases. [43] In Grand Rapids and Phoenix, the Detroit riot was commonly identified, and in Bridgeton and Plainfield, the Newark riot had a similar effect. The major disorders in Detroit and Newark appeared, however, to be important factors in all the disorders which followed them.

Media coverage and rumors generated by the major riots in nearby Newark and Plainfield were the only identifiable final incidents preceding five nearby disorders. [44] In these cases there was a substantial mobilization of police and extensive patrolling of the ghetto area in anticipation of violence.

OFFICIAL CITY ACTIONS

Approximately 14 percent of the prior incidents were identified as action, or in some cases, inaction of city officials other than police or the judiciary. [45] Typically, in Cincinnati two months prior to the disturbance, approximately 200 representatives (mostly Negroes) of the inner-city community councils sought to appear before the city council to request summer recreation funds. The council permitted only one person from the group to speak, and then only briefly, on the ground that the group had not followed the proper procedure for placing the issue on the agenda.

No final incidents were identified in this category.

ADMINISTRATION OF JUSTICE

Eight of the prior incidents involved cases of allegedly discriminatory administration of justice. [46] Typical was a case in Houston a month and a half before the disorder. Three civil rights advocates were arrested for leading a protest and for their participation in organizing a boycott of classes at the predominantly Negro Texas Southern University. Bond was set at $25,000 each. The court refused for several days to reduce bond, even though TSU officials dropped the charges they had originally pressed.

There were no final incidents identified involving the administration of justice.

In a unique case, New Haven, the shooting of a Puerto Rican by a white man was identified as the final incident before violence. [47]

Finally, we have noted a marked relationship between prior and final incidents within each city. In most of the cities surveyed, the final incident was of the same type as one or more of the prior incidents. For example, police actions were identified as both the final incident and one or more prior incidents preceding seven disturbances. [48] Rallies or meetings to protest police actions involved in a prior incident were identified as the final incident preceding three additional disturbances. [49] The cumulative reinforcement of grievances and heightening of tensions found in all instances were particularly evident in these cases.

The Development of Violence

Once the series of precipitating incidents culminated in violence, the riot process followed no uniform pattern in the 24 disorders surveyed. [50] However, some similarities emerge.

The final incident before the outbreak of disorder, and the initial violence itself, generally occurred at a time and place in which it was normal for many people to be on the streets. In most of the 24 disorders, groups generally estimated at 50 or more persons were on the street at the time and place of the first outbreak. [51]

In all 24 disturbances, including the three university-related disorders, the initial disturbance area consisted of streets with relatively high concentrations of pedestrian and automobile traffic at the time. In all but two cases -- Detroit and Milwaukee -- violence started between 7:00 p.m. and 12:30 a.m., when the largest numbers of pedestrians could be expected. Ten of the 24 disorders erupted on Friday night, Saturday or Sunday. [52]

In most instances, the temperature during the day on which violence first erupted was quite high. [53] This contributed to the size of the crowds on the street, particularly in areas of congested housing.

Major violence occurred in all 24 disorders during the evening and night hours, between 6: 00 p.m. and 6: 00 a.m., and in most cases between 9: 00 p.m. and 3: 00 a.m. [54] In only a few disorders, including Detroit and Newark, did substantial violence occur or continue during the daytime. [55] Generally, the night-day cycles continued in daily succession through the early period of the disorder. [56]

At the beginning of disorder, violence generally flared almost immediately after the final precipitating incident. [57] It then escalated quickly to its peak level, in the case of one-night disorders, and to the first night peak in the case of continuing disorders. [58] In Detroit and Newark, the first outbreaks began within two hours and reached severe, although not the highest, levels within three hours.

In almost all of the subsequent night-day cycles, the change from relative order to a state of disorder by a number of people typically occurred extremely rapidly -- within one or two hours at the most. [59]

Nineteen of the surveyed disorders lasted more than one night. [60] In 10 of these, violence peaked on the first night, and the level of activity on subsequent nights was the same or less. [61] In the other nine disorders, however, the peak was reached on a subsequent night. [62]

Disorder generally began with less serious violence against property, such as rock and bottle throwing and window breaking. [63] These were usually the materials and the targets closest to hand at the place of the initial outbreak.

Once store windows were broken, looting usually followed. [64] Whether fires were set only after looting occurred is unclear. Reported instances of fire-bombing and Molotov cocktails in the 24 disorders appeared to occur as frequently during one cycle of violence as during another in disorders which continued through more than one cycle. [65] However, fires seemed to break out more frequently during the middle cycles of riots lasting several days. [66] Gunfire and sniping were also reported more frequently during the middle cycles. [67]

The Control Effort

What type of community response is most effective once disorder erupts is clearly a critically important question. Chapter 12, "Control of Disorder," and the Supplement on Control of Disorder to this report consider this question at length. We consider in this section the variety of control responses, official and unofficial, which were utilized in the 24 surveyed disorders, including:

• Use or threatened use of local official force;
• Use or threatened use of supplemental official force from other jurisdictions;
• Negotiations between officials and representatives from the Negro community;
• On-the-street persuasion by "counter-rioters."

Disorders are sometimes discussed as if they consisted of a succession of confrontations and withdrawals by two cohesive groups, the police or other control force on one side and a riotous mob on the other. Often it is assumed that there was no effort within the Negro community to reduce the violence. Sometimes the only remedy prescribed is mobilization of the largest possible police or control force, as early as possible.

None of these views are accurate. We found that:

• A variety of different control forces employed a variety of tactics, often at the same time, and often in a confused situation;
• Substantial non-force control efforts, such as negotiations and on-the-street persuasion by "counter-rioters," were usually under way, often simultaneously with forcible control efforts; counter-rioter activity often was carried on by Negro residents of the disturbance area, sometimes with and often without official recognition;
• No single tactic appeared to be effective in containing or reducing violence in all situations.

LOCAL OFFICIAL FORCE

In 20 of the 24 disorders, the primary effort to restore order at the beginning of violence was made entirely by local police. [68] In 10 cases no additional outside force was called for after the initial response. [69] In only a few cases was the initial control force faced with crowds too large to control. [70]

The police approach to the initial outbreak of disorder in the surveyed cities was generally cautious. [71] Three, types of response were employed. One was dispersal (clearing the area, either by arrests or by scattering crowds), used in 10 cases. [72] Another was reconnaissance (observing and evaluating developments), used in eight cases. [73] In half of these instances, they soon withdrew from the disturbance area, generally because they believed they were unable to cope with the disorder. [74] The third was containment (preventing movement in or out of a cordoned or barricaded area), used in six cases. [75]

No uniform result from utilization of any of the three control approaches is apparent. In at least half of the 24 cases it can reasonably be said that the approach taken by the police did not prevent the continuation of violence. [76] To the extent that their effectiveness is measurable, the conclusion appears to hold for subsequent police control responses as well. [77] There is also evidence, in some instances, of over-response in subsequent cycles of violence. [78]

The various tactical responses we have described are not mutually exclusive, and in many instances combinations were employed. The most common were attempts at dispersal in the disturbance area and a simultaneous cordon or barricade at the routes leading from the disturbance area to the central commercial area of the city, either to contain the disturbance or to prevent persons outside the area from entering it, or both. [79]

In 11 disorders a curfew was imposed at some time, either as the major dispersal technique or in combination with other techniques. [80]

In only four disorders was tear gas used at any point as a dispersal technique. [81]

Only Newark and New Haven used a combination of all three means of control, cordon, curfew and tear gas. [82]

SUPPLEMENTAL OFFICIAL FORCE

The addition of outside force from other jurisdictions was also not invariably successful.

In nine disturbances -- involving a wide variation in the intensity of violence -- additional control forces were brought in after there had been serious violence which local police had been unable to handle alone. [83] In every case further violence occurred, often more than once and often of equal or greater intensity than before. [84]

The result was the same where extra forces were mobilized prior to serious violence. In four cities where this was done, [85] violence nonetheless occurred, in most cases more than once, [86] and often of equal or greater intensity than in the original outbreak. [87]

In the remaining group of seven cities no outside control forces were called, [88] because the level and duration of violence were lower. Outbreaks in these cities nevertheless followed the same random pattern as in the cities which did use outside forces. [89]

NEGOTIATION

In 21 of the 24 disturbances surveyed, discussion or negotiation occurred during the disturbances. These took the form of relatively formal meetings between government officials and Negroes during which grievances and issues were discussed and means were sought to restore order. [90]

Such meetings were usually held either immediately before or soon after the outbreak of violence. [91] Meetings often continued beyond the first or second day of the disorder and, in a few instances, through the entire period of the disorder. [92]

The Negro participants in these meetings usually were established leaders in the Negro community, such as city councilmen or members of human relations commissions, ministers, or officers of civil rights or other community organizations. [93] However, Negro youths were participants in over one-third of these meetings. [94] In a few disorders both the youths and the adult Negro leaders participated, [95] sometimes without the participation of local officials. [96]

Employees of community action agencies occasionally participated, either as intermediaries or as participants. In some cases they provided the meeting place. [97]

Discussions usually included issues generated by the disorder itself, such as the treatment of arrestees by the police. [98] In 12 cases, prior ghetto grievances, such as unemployment and inadequate recreational facilities, were included as subjects. [99] Often both disorder-related and prior grievances were discussed [100] with the focus generally shifting from the former to the latter as the disorder continued.

How effective these meetings were is, as in the case of forcible response, impossible to gauge. Again, much depends on who participated, timing, and what other responses were being made at the same time.

COUNTER-RIOTERS

In all but six of the 24 disorders, Negro private citizens were active on the streets attempting to restore order primarily by means of persuasion. [101] In a Detroit survey of riot area residents over the age of 15, some 14 percent stated that they had been active as counter-rioters. [102]

Counter-rioters sometimes had some form of official recognition from either the mayor or a human relations council. [103] Police reaction in these cases varied from total opposition to close cooperation. [104] In most such cases some degree of official authorization was given before the activity of the counter-rioters began, [105] and in a smaller number of cases, their activity was not explicitly authorized but merely condoned by the authorities. [106]

Distinctive insignia were worn by the officially recognized counter-rioters in at least a few cities. [107] In Dayton and Tampa, the white helmets issued to the counter-rioters have made the name "White Hats" synonymous with counter-rioters. Public attention has centered on the officially-recognized counter-rioters. However, counter-rioters are known to have acted independently, without official recognition, in a number of cities. [108]

Counter-rioters generally included young men, ministers, community action agency and other anti-poverty workers and well-known ghetto residents. [109]

Their usual technique was to walk through the disturbance area urging people to "cool it," although they often took other positive action as well, such as distributing food. [110]

How effective the counter-rioters were is, again, difficult to estimate. Authorities in several cities indicated that they believed they were helpful.

III. THE RIOT PARTICIPATION

It is sometimes assumed that the rioters were criminal types, overactive social deviants, or riffraff -- recent migrants, members of an uneducated underclass -- alienated from responsible Negroes, and without broad social or political concerns. It is often implied that there was no effort within the Negro community to attempt to reduce the violence.

Determining who participated in a civil disorder is difficult. We have obtained data on participation from four different sources. [111]

• Eyewitness accounts, from more than 1,200 interviews in our staff reconnaissance survey of 20 cities;
• Interview surveys based on probability samples of riot area residents in the two major riot cities -- Detroit and Newark -- designed to elicit anonymous self-identification of participants as rioters, counter-rioters or non-involved;
• Arrest records from 22 cities;
• A special study of arrestees in Detroit

Only partial information is available on the total numbers of participants. In the Detroit survey, approximately 11 [112] percent of the sampled residents over the age of 15 in the two disturbance areas admittedly participated in rioting; another 20 to 25 percent admitted to having been bystanders but claimed that they had not participated; approximately 16 percent claimed they had engaged in counter-riot activity; and the largest proportion (48 to 53 percent) claimed they were at home or elsewhere and did not participate. However, a large proportion of the Negro community apparently believed that more was gained than lost through rioting, according to the Newark and Detroit surveys. [2]

Greater precision is possible in describing the characteristics of those who participated. We have combined the data from the four sources to construct a profile of the typical rioter and to compare him with the counter-rioter and the noninvolved.

The Profile of a Rioter

The typical rioter in the summer of 1967 was a Negro, unmarried male between the ages of 15 and 24 in many ways very different from the stereotypes. He was not a migrant. He was born in the state and was a life-long resident of the city in which the riot took place. Economically his position was about the same as his Negro neighbors who did not actively participate in the riot.

Although he had not, usually, graduated from high school, he was somewhat better educated than the average inner-city Negro, having at least attended high school for a time.

Nevertheless, he was more likely to be working in a menial or low status job as an unskilled laborer. If he was employed, he was not working full time and his employment was frequently interrupted by periods of unemployment.

He feels strongly that he deserves a better job and that he is barred from achieving it, not because of lack of training, ability, or ambition, but because of discrimination by employers.

He rejects the white bigot's stereotype of the Negro as ignorant and shiftless. He takes great pride in his race and believes that in some respects Negroes are superior to whites. He is extremely hostile to whites, but his hostility is more apt to be a product of social and economic class than of race; he is almost equally hostile toward middle-class Negroes.

He is substantially better informed about politics than Negroes who were not involved in the riots.. He is more likely to be actively engaged in civil rights efforts, but is extremely distrustful of the political system and of political leaders.

The Profile of the Counter-Rioter

The typical counter-rioter, who risked injury and arrest to walk the streets urging rioters to "cool it," was an active supporter of existing social institutions. He was, for example, far more likely than either the rioter or the noninvolved to feel that this country is worth defending in a major war. His actions and his attitudes reflected his substantially greater stake in the social system; he was considerably better educated and more affluent than either the rioter or the noninvolved. He was somewhat more likely than the rioter, but less likely than the noninvolved, to have been a migrant. In all other respects he was identical to the noninvolved. [113]
admin
Site Admin
 
Posts: 36230
Joined: Thu Aug 01, 2013 5:21 am

Re: Report of the National Advisory (Kerner Report 1967)

Postby admin » Mon May 02, 2016 9:18 am

Part 2 of 5

Characteristics of Participants

Race -- Eighty-three percent of the arrestees were Negroes; 15 percent were whites. [114] Our interview in 20 cities indicate that almost all rioters were Negroes.

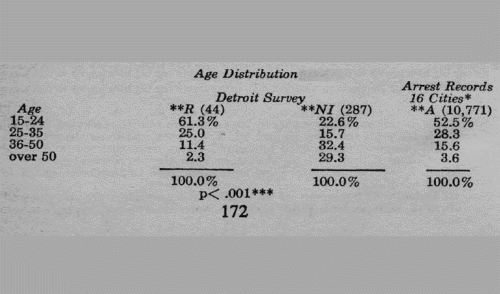
Age -- The survey data from Detroit, the arrest records, and our interviews in 20 cities, all indicate that the rioters were late teenagers or young adults. [115] In the Detroit survey, 61.3 percent of the self-reported rioters were between the ages of 15 and 24, and 86.3 percent were between 15 and 35. The arrest data indicate that 52.5 percent of the arrestees were between 15 and 24, and 80.8 percent were between 15 and 35.

Of the noninvolved, by contrast, only 22.6 percent in the Detroit survey were between 15 and 24, and 38.3 percent were between 15 and 35.

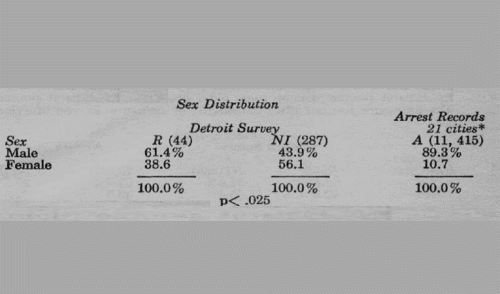
Sex -- In the Detroit survey 61.4 percent of the self-reported rioters were male. Arrestees, however, were almost all male -- 89.3 percent. [116] Our interviews in 20 cities indicate that the majority of rioters were male. The large difference in proportion between the Detroit survey data and the arrest figures probably reflects either selectivity in the arrest process or less dramatic, less provocative riot behavior by women.

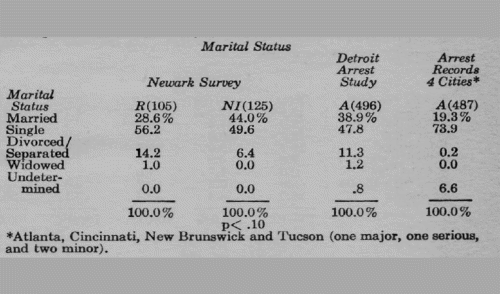
Family Structure -- Three sources of available information -- the Newark survey, the Detroit arrest study, and arrest records from four cities-indicate a tendency for rioters to be single. The Newark survey indicates that rioters were single -- 56.2 percent -- more often than the noninvolved -- 49.6 percent.

The Newark survey also indicates that rioters were more likely to have been divorced or separated -- 14.2 percent -- than the noninvolved -- 6.4 percent. However, the arrest records from four cities indicate that only a very small percentage of the arrestees fall in this category.

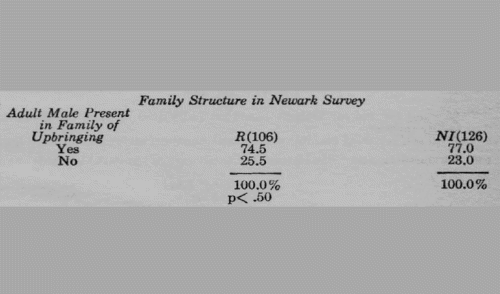
In regard to the structure of the family in which he was raised, the self-reported rioter, according to the Newark survey, was not significantly different from many of his Negro neighbors who did not actively participate in the riot. Twenty-five and five tenths percent of the self-reported rioters and 23.0 percent of the noninvolved were brought up in homes without a male head of household. [118]

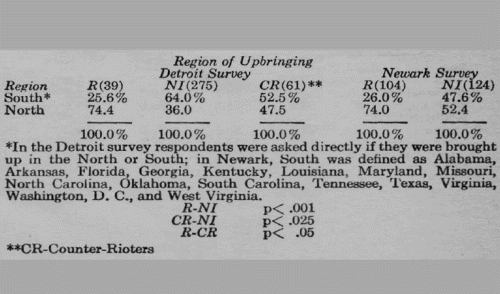
Region of Upbringing -- Both survey data [119] and arrest records [120] demonstrate unequivocally that those brought up in the region in which the riot occurred are much more likely to have participated in the riots. The percentage of rioters brought up in the North is almost identical for the Detroit survey -- 74.4 percent -- and the Newark survey -- 74.0 percent. By contrast, of the noninvolved, 36.0 percent in Detroit and 52.4 percent in Newark were brought up in the North. [121]

Data available from five cities on the birthplace of arrestees indicate that 63 percent of the arrestees were born in the region in which the disorder occurred. Although birthplace is not necessarily identical with place of upbringing, the data are sufficiently similar to provide strong support for the conclusion.

Of the self-reported counter-rioters, however, 47.5 percent were born in the North, according to the Detroit survey, a figure which places them between self-reported rioters and the noninvolved. It appears from the data on Northern riots that a significant consequence of growing up in the South was a tendency toward noninvolvement in a riot situation, while involvement in a riot, either in support of or against existing social institutions, was more common among those born in the North.

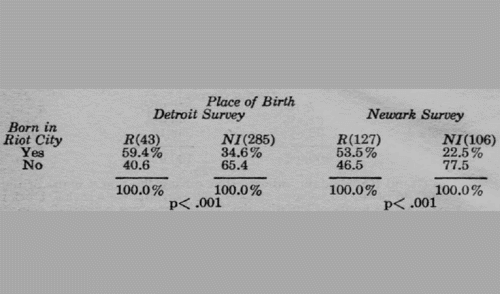
Residence -- Rioters are not only more likely than the noninvolved to have been born in the North, but they are also more likely to have been long-term residents of the city in which the disturbance took place. [122] The Detroit survey data indicate that 59.4 percent of the rioters, but only 34.6 percent of the non involved, were born in Detroit. The comparable figures in the Newark survey are 53.5 percent and 22.5 percent.

Outsiders who temporarily entered the city during the riot might have left before the surveys were conducted and therefore may be underestimated in the survey data. However, the arrest data, [123] which is contemporaneous with the riot, suggest that few outsiders were involved: 90 percent of those arrested resided in the riot city. Seven percent lived in the same state. Only 1 percent was from outside the state. Our interviews in 20 cities also corroborate these conclusions.

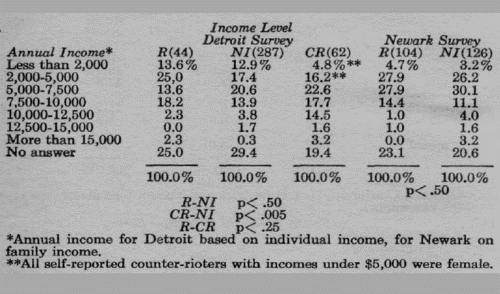
Income -- In the Detroit arid Newark survey data, income level alone does not seem to correlate with self-reported riot participation. [124] The figures from the two cities are not directly comparable since respondents were asked for individual income in Detroit, and family income in Newark. More Detroit rioters (38.6 percent) had annual incomes under $5,000 per year than the noninvolved (30.3 percent), but even this small difference disappears when the factor of age is taken into account.

In the Newark data, in which the age distributions of the rioters and the noninvolved are more similar, there is almost no difference between the rioters, 32.6 percent of whom had annual incomes under $5,000, and the noninvolved, 29.4 percent of whom had annual incomes under $5,000.

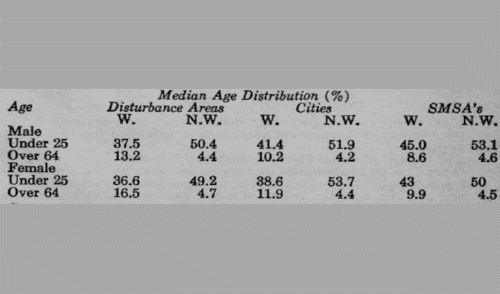
The similarity in income distribution should not, however, lead to the conclusion that more affluent Negroes are as likely to riot as poor Negroes. Both surveys were conducted in disturbance areas in which incomes are considerably lower than in the city as a whole and the surrounding metropolitan area. [125] Nevertheless, the data show that rioters are not necessarily the poorest of the poor.

While incomes does not distinguish rioters from those who were not involved, it does distinguish counter-rioters from rioters and the noninvolved. Less than 9 percent of both those who rioted and those not involved earn more than $10,000 annually. Yet almost 20 percent of the counter-rioters earned this amount or more. In fact, there were no male self-reported counter-rioters in the Detroit survey who earned less than $5,000 annually. In the Newark sample there were seven respondents who owned their own homes; none of them participated in the riot. While extreme poverty does not necessarily move a man to riot, relative affluence seems at least to inhibit him from attacking the existing social order and may motivate him to take considerable risks to protect it.

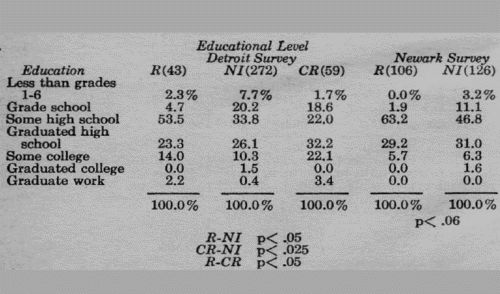
Education -- Level of schooling is strongly related to participation. Those with some high school education were more likely to riot than those who had only finished grade school. [126] In the Detroit survey 93 percent of the self-reported rioters had gone beyond grade school, compared with 72.1 percent of the noninvolved. In the Newark survey the comparable figures are 98.1 percent and 85.7 percent. The majority of self-reported rioters are not, however, high school graduates.

The counter-rioters were clearly the best educated of the three groups. Approximately twice as many counter-rioters had attended college as had the noninvolved, and half again as many counter-rioters had attended college as rioters. Considered along with the information on income, this suggests that counter-rioters are probably well on their way into the middle class.

Education and income are the only factors which distinguish the counter-rioter from the noninvolved. Apparently, high levels of education and income not only prevent rioting but are more likely to lead to active, responsible opposition to rioting.

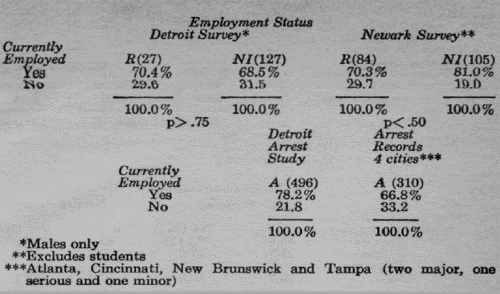
Employment -- The Detroit and Newark surveys, the arrest records from four cities, and the Detroit arrest study all indicate that there are no substantial differences in unemployment between the rioters and the noninvolved. [127]

Unemployment levels among both groups were extremely high. In the Detroit survey, 29.6 percent of the self-reported rioters were unemployed; in the Newark survey, 29.7 percent; in the four-city arrest data, 33.2 percent; and in the Detroit arrest study, 21.8 percent. The unemployment rates for the noninvolved in the Detroit and Newark surveys were 31.5 and 19.0 percent.

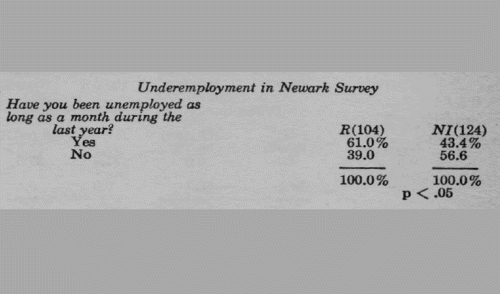
Self-reported rioters were more likely to be only intermittently employed, however, than the noninvolved. Respondents in Newark were asked whether they had been unemployed for as long as a month or more during the last year. [128] Sixty-one percent of the self-reported rioters, but only 43.4 percent of the noninvolved, answered, "Yes."

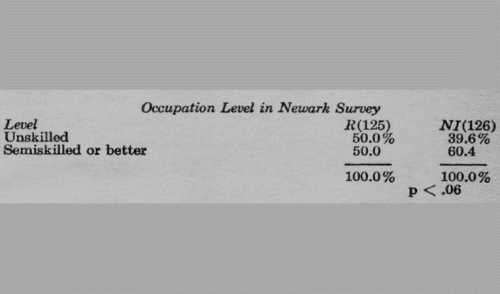
Despite generally higher levels of education, rioters are more likely than the noninvolved to be employed in unskilled jobs. [129] In the Newark survey, 50.0 percent of the self-reported rioters, but only 39.6 percent of the noninvolved, had unskilled jobs.

Attitudes About Employment -- The Newark survey data indicate that self-reported rioters were more likely to feel dissatisfied with their present jobs than were the noninvolved. [130]

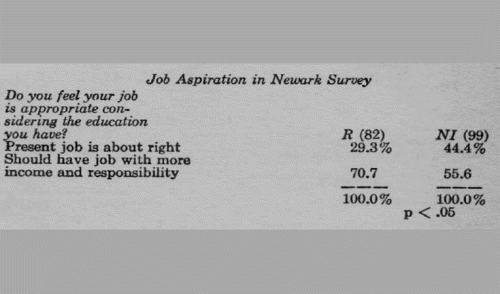
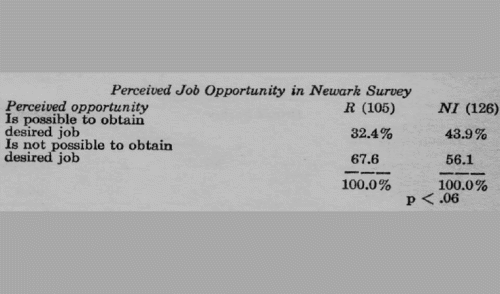
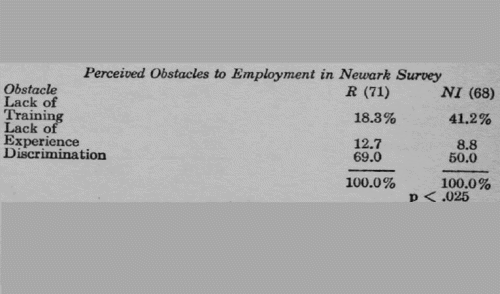
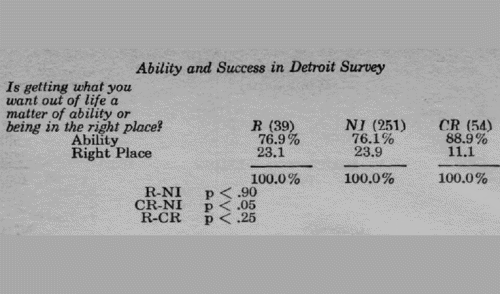
Only 29.3 percent of the rioters, compared with 44.4 percent of the noninvolved, thought their present jobs to be appropriate for them in responsibility and pay. Of the self-reported rioters, 67.6 percent, compared with 56.1 percent of the noninvolved, felt that it was impossible to obtain the kind of job they wanted. [131] Of the self-reported rioters, 69 percent, as compared with 50.0 percent of the noninvolved, felt that racial discrimination was the major obstacle to their finding better employment. [132] Despite this feeling, surprising numbers of rioters, (76.9 percent) responded that "getting what you want out of life is a matter of ability, not being in the right place at the right time." [133]

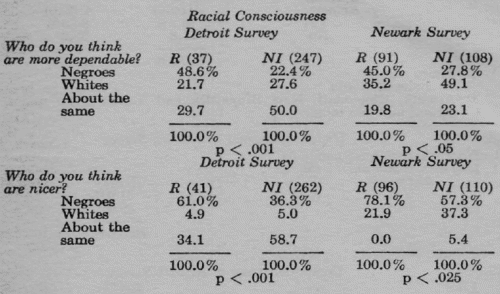
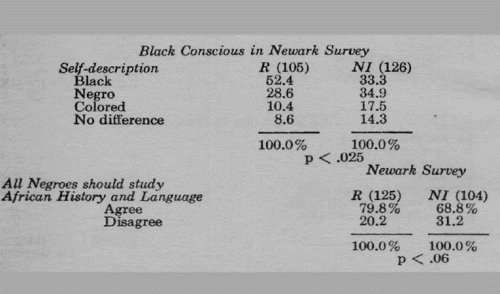
Racial Attitudes -- The Detroit and Newark surveys indicate that rioters have strong feelings of racial pride, if not racial superiority. [134] In the Detroit survey, 48.6 percent of the self-reported rioters said that they felt Negroes were more dependable than whites. Only 22.4 percent of the noninvolved stated this. In Newark, the comparable figures were 45.0 and 27.8 percent. The Newark survey data indicate that rioters want to be called "black" rather than "Negro" or "colored" and are somewhat more likely than the noninvolved to feel that all Negroes should study African history and languages. [135]

To what extent this racial pride antedated the riot and to what extent it was produced by the riot is impossible to determine from the survey data. Certainly the riot experience seems to have been associated with increased pride in the minds of many of the participants. This was vividly illustrated by the statement of a Detroit rioter:

Interviewer: You said you were feeling good when you followed the crowd?

Respondent: I was feeling proud, man, at the fact that I was a Negro. I felt like I was a first class citizen. I didn't feel ashamed of my race because of what they did.

Similar feelings were expressed by an 18-year-old Detroit girl who reported that she had been a looter:

Interviewer: What is the Negro then if he's not American? Respondent: A Negro, he's considered a slave to the white folks. But half of them know that they're slaves and feel that they can't do nothing about it because they're just going along with it. But most of them they seem to get it in their heads now how the white folks treat them and how they've been treating them and how they've been slaves for the white folks....

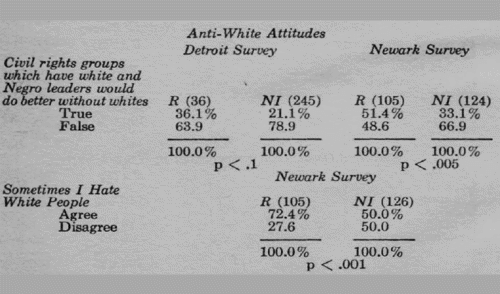
Along with increased racial pride there appears to be intense hostility toward whites. [136] Self-reported rioters in both the Detroit and Newark surveys were more likely to feel that civil rights groups with white and Negro leaders would do better without the whites. In Detroit, 36.1 percent of the self-reported rioters thought that this statement was true, while only 21.1 percent of the noninvolved thought so. In the Newark survey, 51.4 percent of the self-reported rioters agreed; 33.1 percent of the noninvolved shared this opinion.

Self-reported rioters in Newark were also more likely to agree with the statement, "Sometimes I hate white people." Of the self-reported rioters, 72.4 percent agreed; of the noninvolved, 50.0 percent agreed.

The intensity of the self-reported rioters' racial feelings may suggest that the recent riots represented traditional interracial hostilities. Two sources of data suggest that this interpretation is probably incorrect.

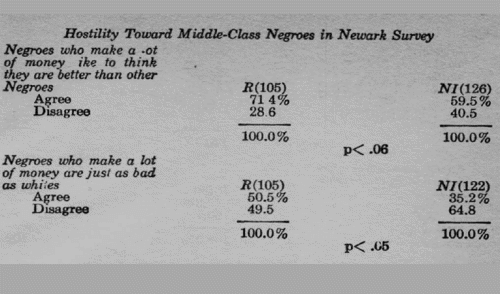
First, the Newark survey data indicate that rioters were almost as hostile to middle-class Negroes as they were to whites.137 Seventy-one and four-tenths percent of the self-reported rioters, but only 59.5 percent of the noninvolved, agreed with the statement, "Negroes who make a lot of money like to think they are better than other Negroes." Perhaps even more significant, particularly in light of the rioters' strong feelings of racial pride, is that 50.5 percent of the self-reported rioters agreed that "Negroes who make a lot of money are just as bad as white people." Only 35.2 percent of the noninvolved shared this opinion.

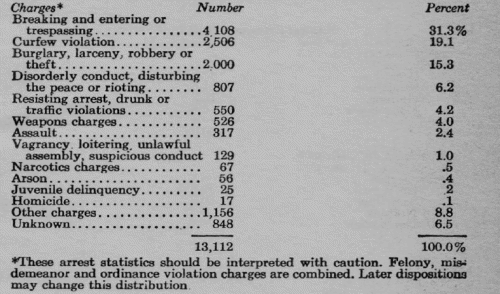
Second, the arrest data show that the great majority of those arrested during the disorders were generally charged with a crime relating to looting or curfew violations. [138] Only 2.4 percent of the arrests were for assault and 0.1 percent were for homicide, but 31.3 percent of the arrests were for breaking and entering -- crimes directed against white property rather than against individual whites.

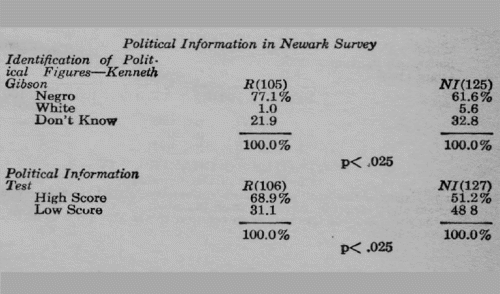
Political Attitudes and Involvement -- Respondents in the Newark survey were asked about relatively simple items of political information, such as the race of prominent local and national political figures. In general, the self-reported rioters were much better informed than the noninvolved. [139] For example, self-reported rioters were more likely to know that one of the 1966 Newark mayoral candidates was a Negro. Of the rioters, 77.1 percent -- but only 61.6 percent of the non involved -- identified him correctly. The overall scores on a series of similar questions also reflect the self-reported rioters' higher levels of information.

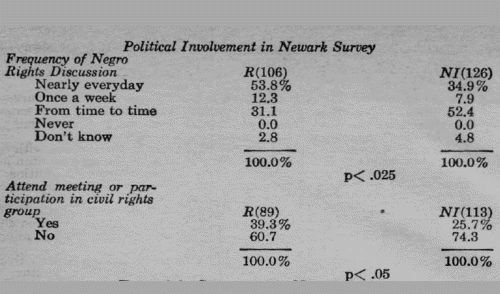
Self-reported rioters were also more likely to be involved in activities associated with Negro rights. [140] At the most basic level of political participation, they were more likely than the noninvolved to talk frequently about Negro rights. In the Newark survey, 53.8 percent of the self-reported rioters, but only 34.9 percent of the noninvolved, said that they talked about Negro rights nearly every day.

The self-reported rioters also were more likely to have attended a meeting or participated in civil rights activity. Of the rioters, 39.3 percent -- but only 25.7 percent of the noninvolved -- reported that they had engaged in such activity.

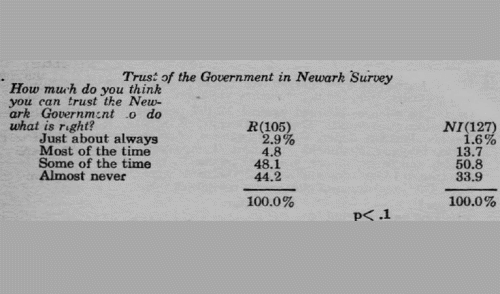
In the Newark survey, respondents were asked how much they thought they could trust the local government. [141] Only 4.8 percent of the self-reported rioters, compared with 13.7 percent of the noninvolved, said that they felt they could trust it most of the time; 44.2 percent of the self-reported rioters and 33.9 percent of the noninvolved reported that they could almost never trust the government.

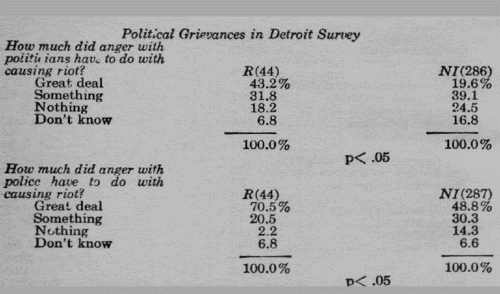
In the Detroit survey, self-reported rioters were much more likely to attribute the riot to anger about politicians and police than were the noninvolved. [142] Of the self-reported rioters, 43.2 percent -- but only 19.6 percent of the noninvolved -- said anger at politicians had a great deal to do with causing the riot. Of the self-reported rioters, 70.5 percent, compared with 48.8 percent of the noninvolved, believed that anger at the police had a great deal to do with causing the riot.

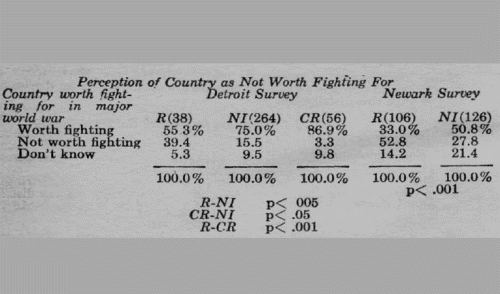
Perhaps the most revealing and disturbing measure of the rioters' anger at the social and political system was their response to a question asking whether they thought "the country was worth fighting for in the event of a major world war." [143] Of the self-reported rioters, 39.4 percent in Detroit and 52.8 percent in Newark shared the view that it was not. By contrast, 15.5 percent of the noninvolved in Detroit and 27.8 percent of the noninvolved in Newark shared this sentiment. Almost none of the self-reported counter-rioters in Detroit -- 3.3 percent -- agreed with the self-reported rioters.

Some comments of interviewees are worthy of note:

Not worth fighting for -- if Negroes had an equal chance it would be worth fighting for.

Not worth fighting for -- I am not a true citizen so why should I?

Not worth fighting for -- because my husband came back from Vietnam and nothing had changed.


IV. THE BACKGROUND OF DISORDER

In response to the President's questions to the Commission about the riot environment, we have gathered information on the pre-riot conditions in 20 of the cities surveyed. [144] We have sought to analyze the backgrounds of the disorders in terms of four basic groupings of information:

• The social and economic conditions as described in the 1960 census. with particular reference to the area of each city in which the disturbance took place;
• Local governmental structure and its organizational capacity to respond to the needs of the people, particularly those living in the most depressed conditions;
• The extent to which federal programs assisted in meeting these needs; and
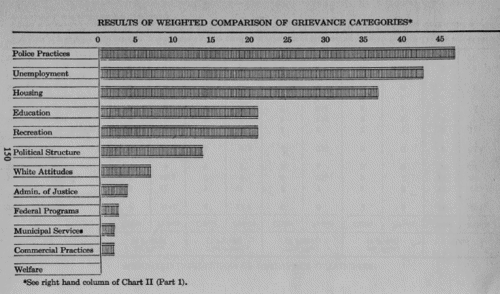
• The nature of the grievances in the ghetto community.

It is sometimes said that conditions for Negroes in the riot cities have improved over the years and are not materially different from conditions for whites; that local government now seeks to accommodate the demands of Negroes and has created many mechanisms for redressing legitimate complaints; that federal programs now enable most Negroes who so desire, to live comfortably through welfare, housing, employment or anti-poverty assistance; and that grievances are harbored only by a few malcontents and agitators.

Our findings are to the contrary. In the riot cities we surveyed, we found that Negroes are severely disadvantaged, especially as compared with whites; that local government is often unresponsive to this fact; that federal programs have not yet reached a significantly large proportion of those in need; and that the result is a reservoir of unredressed grievances and frustration in the ghetto. [145]

The Pattern of Disadvantage

Social and economic conditions in the riot cities [146] constituted a clear pattern of severe disadvantage for Negroes as compared with whites, whether the Negroes lived in the disturbance area or outside it. [147] When ghetto conditions are compared with those for whites in the suburbs, the relative disadvantage for Negroes is even greater.

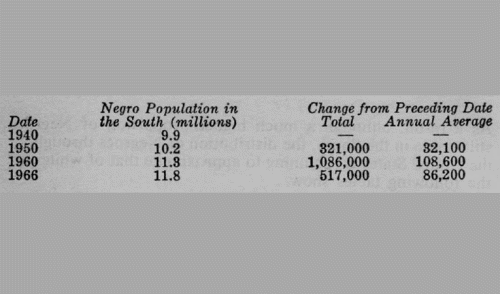
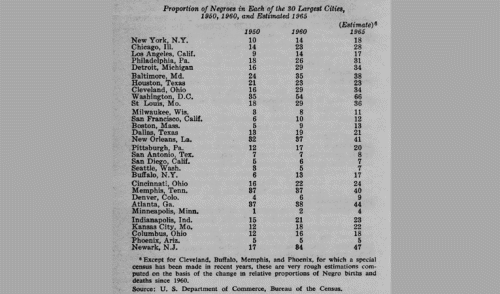
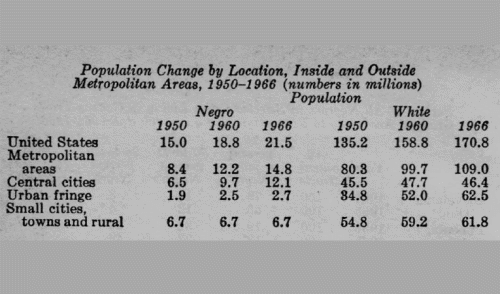
In all the cities surveyed, the Negro population increased between 1950 and 1960 at a median rate of 75 percent. [148]

Meanwhile, the white population decreased in more than half the cities -- including six which experienced the most severe disturbances in 1967. The increase in nonwhite population in four of these cities was so great that their total population increased despite the decrease in white population.149 These changes were attributable in large part to heavy immigration of Negroes from rural poverty areas and movement of whites from the central cities to the suburbs.
In all the cities surveyed:

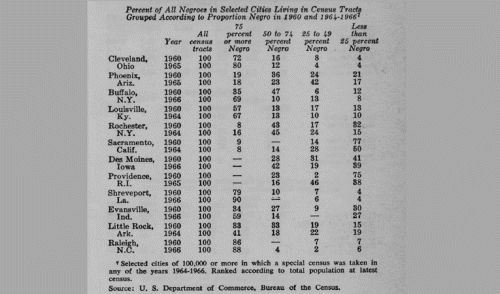
• The percentage of Negro population in the disturbance area exceeded the percentage of Negro population in the entire city. In some cases it is twice, and in nine instances triple, the city-wide percentage. [150]
• The Negro population was invariably younger than the white population. [151]
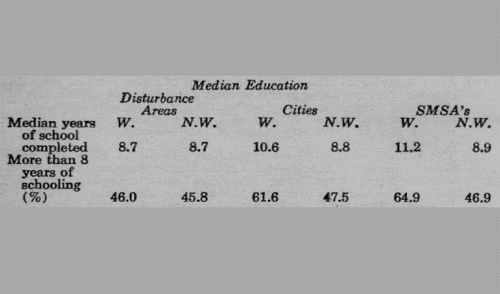
• Negroes had completed fewer years of education and proportionately fewer had attended high school than whites. [152]
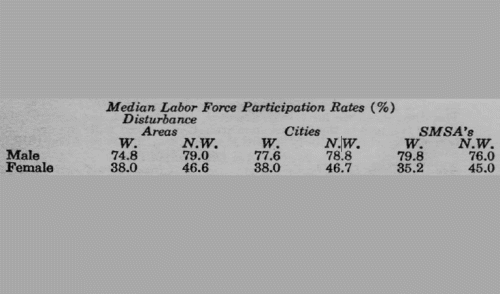
• A larger percentage of Negroes than whites were in the labor force. [153]
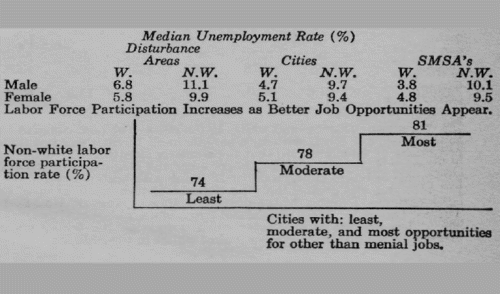
• Yet they were twice as likely to be unemployed as whites. [154]
• In cities where they had greater opportunities to work at skilled or semi-skilled jobs, proportionately more Negro men tended to be working, or looking for work, than white men. Conversely, the proportion of men working, or looking for work, tended to be lower among Negroes than whites in cities that offered the least opportunities to do skilled or semi-skilled labor. [155]
• Among the employed, Negroes were more than three times as likely to be in unskilled and service jobs than whites. [156]
• Negroes earned less than whites in all the surveyed cities, averaging barely 70 percent of white income, and were more than twice as likely to be living in poverty. [157]
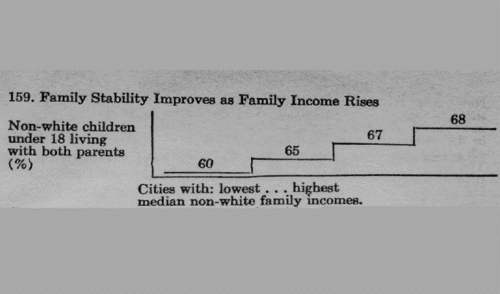
• A smaller proportion of Negro children than white children under 18 were living with both parents. [158]
• However, family "responsibility" was strongly related to opportunity. In cities where the proportion of Negro men in better-than- menial jobs was higher, median Negro family income was higher, and the proportion of children under 18 living with both parents was also higher. Both family income and family structure showed greater weakness in cities where job opportunities were more restricted to unskilled jobs. [159]
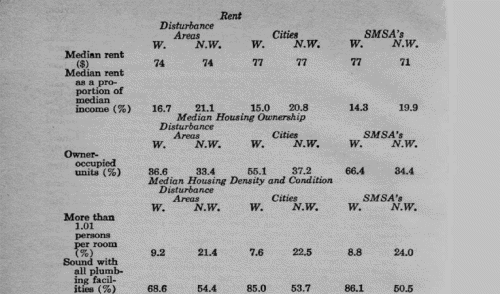
• Fewer Negroes than whites owned their own homes. Among non-home owners, Negroes paid the same rents, yet they paid a higher share of their incomes for rent than did whites. Although housing cost Negroes relatively more, their housing was three times as likely to be overcrowded and substandard as dwellings occupied by whites. [160]

Local Governmental Structure

From our survey of the structure of local government in the riot cities it appears that:

• All major forms of local government were represented.
• In a substantial minority of instances, a combination of at-large election of legislators and a "weak-mayor" system resulted in fragmentation of political responsibility and accountability.
• The proportion of Negroes in government was substantially smaller than the Negro proportion of population.
• Almost all the cities had a formal grievance machinery, but typically it was regarded by most Negroes interviewed as ineffective, and generally ignored.

All major forms of municipal government were represented in the 20 cities examined. [161] Fourteen had a mayor-city council form of government, five had a council-city manager form, and one bad a commission form. [162]

The division of power between the legislative and executive branches varied widely from city to city. Of the mayor-council cities, eight could be characterized as "strong mayor/weak city council" systems in the sense that the mayor had broad appointive and veto powers. [163] Five could be characterized as "weak mayor/strong council" forms, where the city council bad broad appointive and veto powers. [164] In one city, Milwaukee, such powers appeared to be evenly balanced. [165]

In 17 of the 20 cities, mayors were elected directly. [166] Mayors were part-time in eight cities. [167] Almost all the cities had a principal executive, either a mayor or a city manager, who earned a substantial annual salary. [168] Terms of office for mayors ranged from two to four years. [169]

Fragmentation of political responsibility and accountability was discernible in eight cities, where all legislators were elected at large and therefore represented no particular legislative ward or district. [170] Six of these cities also had either a city manager or a "weak-mayor" form of government. In these cases, there was heavy reliance upon the city council as the principal elected policy-making authority. This combination of factors appeared to produce even less identification by citizens with any particular elected official than in the 12 cities which elected all legislators from wards or districts [171] or used a combination of election by districts and at large. [172]

The proportion of Negroes in the governments of the 20 cities was substantially smaller than the median proportion of Negro population -- 16 percent. Ten percent of the legislators in the surveyed cities were Negroes. [173] Only in New Brunswick and Phoenix was the proportion of legislators who were Negroes as great as the percentage of the total population that was nonwhite. Six cities had no Negro legislators. [174] Only three cities had more than one Negro legislator: Newark and Plainfield had two, and New Haven had five. None of the twenty cities had or had ever had a Negro mayor or city manager. In only four cities did Negroes hold other important policy-making positions or serve as heads of other municipal departments. [175] In seven cities Negro representatives had been elected to the state legislature. [176]

In 17 of the cities, however, Negroes were serving on boards of education. [177] In all 17 cities which had human relations councils or similar organizations, Negroes were represented on the boards of such organizations.

One of the most surprising findings is that in 17 of the 20 surveyed riot cities, some formal grievance machinery existed prior to the 1967 disorders -- a municipal human relations council or similar organization authorized to receive citizen complaints about racial or other discrimination by public and private agencies. [178] Existence of these formal channels, however, did not necessarily achieve their tension-relieving purpose. They were seldom regarded as effective by Negroes who were interviewed. The councils generally consisted of prominent citizens, including one or more Negroes, serving part time and with little or no salary.

With only one exception, the councils were wholly advisory and mediatory, with power to conciliate and make recommendations but not to subpoena witnesses or enforce compliance. [179] While most of the councils had full-time paid staff, they were generally organized only as loosely-affiliated departments of the city government. [180] The number of complaints filed with the councils was low considering both the size of the Negro populations and the levels of grievance which the disorders manifested. Only five councils received more than 100 complaints a year. [181] In almost all cases, complaints against private parties were mediated informally by these councils. But complaints against governmental agencies usually were referred for investigation to the agencies against whom the complaints were directed. For example, complaints of police misconduct were accepted by most councils and then referred directly to the police for investigation.

In only two cities did human relations councils attempt to investigate complaints against the police. In neither case did they succeed in completing the investigation. [182]

Where there were special channels for complaints against the police, the result appears to have been similar. In several of the cities police-community relations units had been established within the police department, in most instances within two years prior to the disorder. [183] However, complaints about police misconduct generally were forwarded to the police investigative unit, complaint bureau or police chief for investigation.

In all the cities which had a police-community relations unit, during the year preceding the disorder complaints against policemen had been filed with or forwarded to the police department. [184] In at least two of these cities the police department stated that the complaints had been investigated and disciplinary action taken in several cases. [185] Whether or not these departments in fact did take action on the complaints, the results were never disclosed either to the public or to complainants. The grievances on which the complaints were based often appeared to remain alive in the Negro community.

Federal Programs

What was the pattern of governmental effort to relieve ghetto conditions and respond to needs in the cities which experienced disorders in 1967?

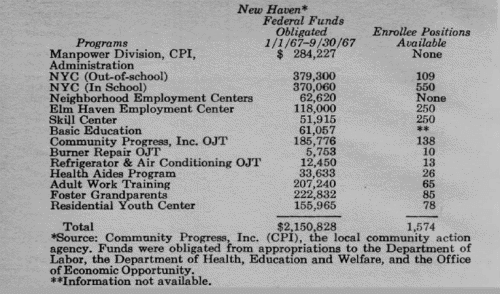
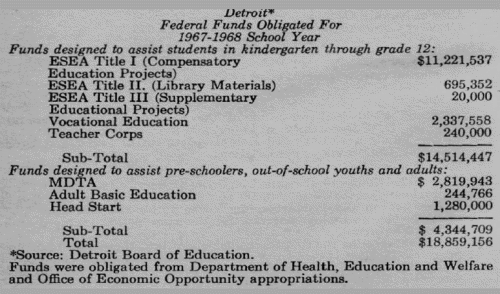
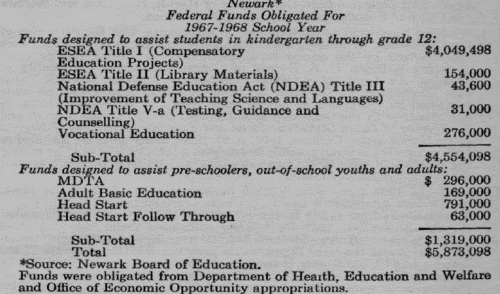
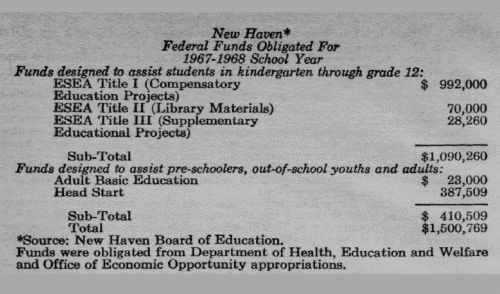
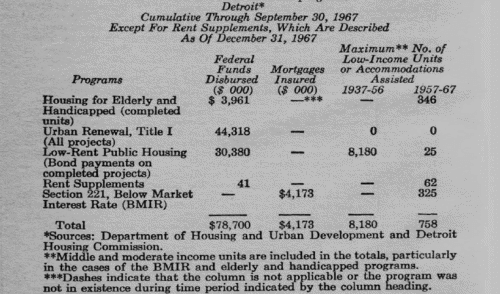
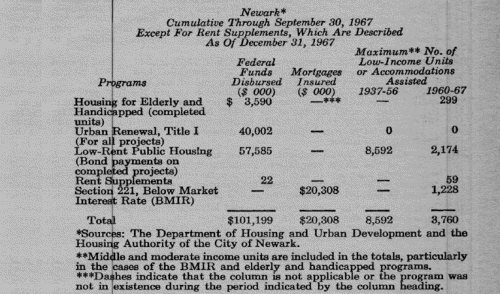
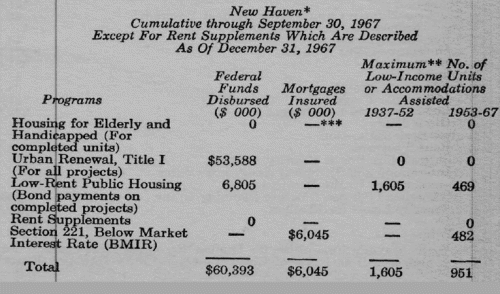
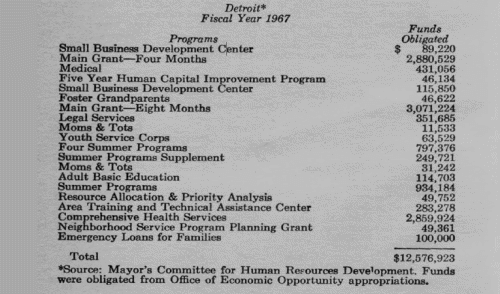
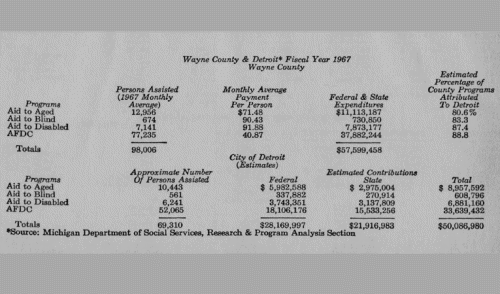
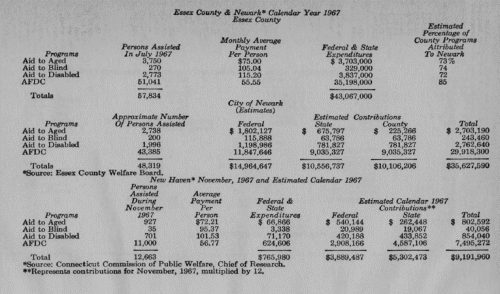
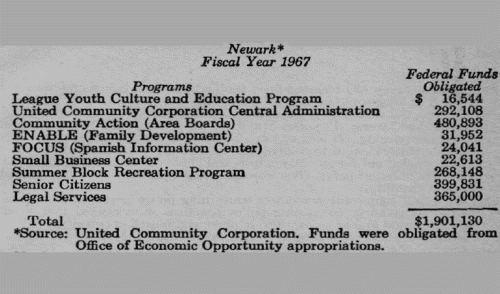
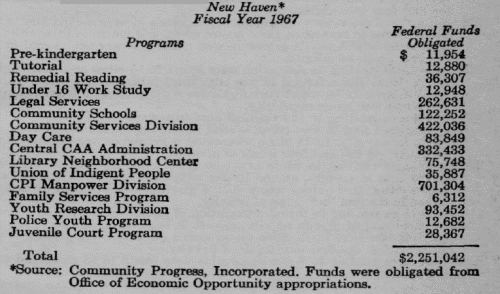
We have not attempted a comprehensive answer to this large and complex question. We have instead surveyed only the key federal anti-poverty programs in Detroit, Newark and New Haven -- cities which received substantial federal funds and also suffered severe disorders.

Of the large number of federal programs to aid cities, we have concentrated on five types, which relate to the most serious conditions and which involve sizeable amounts of federal assistance. We have sought to evaluate these amounts against the proportion of persons reached. [186]

We conclude that:

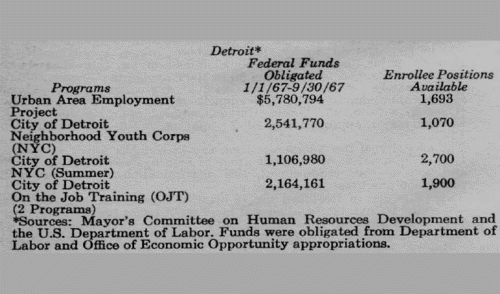
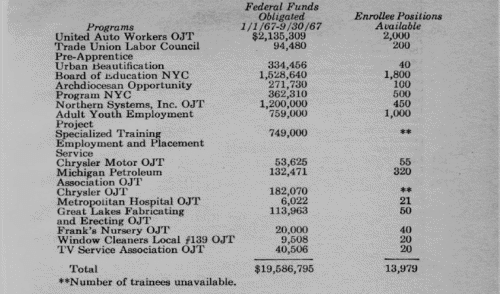
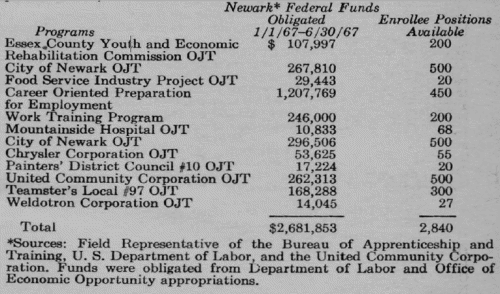
• While these three cities received substantial amounts of federal funds in 1967 for manpower, education, housing, welfare and community action programs, the number of persons assisted by those programs in almost all cases constituted only a fraction of those in need.
• In at least 11 of the 15 programs examined (five programs in each of the three cities), the number of people assisted in 1967 was less than half of those in need.
• In one of the 15 programs the percentage rose as high as 72 percent.
• The median was 33 percent.

Manpower -- our study included all major manpower and employment programs financed in the three cities by the federal government, including basic and remedial education, skill training, on-the-job training, job counseling, and placement. [187]

A 1966 Department of Labor study of 10 slum areas, as well as our own survey of 20 disorder areas, indicate that underemployment is an even more serious problem for ghetto residents than unemployment. However, our measurement of need for manpower programs is based on unemployment figures alone because underemployment data are not available for the three cities surveyed. The Department of Labor estimates that underemployment rates in major central city ghettos are a multiple of the unemployment rate.

In Detroit in the first three quarters of 1967, federal funds, obligated in the amount of $19.6 million, provided job training opportunities for less than one-half of the unemployed.

During the first nine months of 1967, the labor force in Detroit totalled 650,000 persons, of whom 200,000 were Negroes. The average unemployment rate for that period w. 2.7 percent for whites and 9.6 percent for Negroes. The total average number unemployed during that period was 31,350. of whom 19,200 (61 percent) were Negroes.

During the same period, there were 22 manpower programs (excluding MDTA institutional programs) in various stages of operation in Detroit. Twenty of the programs provided for 13,979 trainees. [188]

In Newark, in the first half of 1967, $2.6 million of federal funds provided job training opportunities for less than 20 percent of the unemployed. [189] And in New Haven, during the first three quarters of 1967, federal funds in the amount of $2.1 million provided job training opportunities for less than one-third of the unemployed. [190]

Education -- For purposes of comparing funding to needs, we have limited our examination to two major federal education programs for the disadvantaged: the Title I program under the Elementary and Secondary Education Act of 1965 (ESEA) and the Adult Basic Education program. Title I provides assistance to schools having concentrations of educationally disadvantaged children, defined as children from families having annual incomes of less than $3,000 or supported by the Aid to Families with Dependent Children program (AFDC). Title I supports remedial reading, career guidance for potential dropouts, reduced pupil-teacher ratios, special teacher training, educational television and other teaching equipment, and specialized staff for social work, guidance and counseling, psychiatry and medicine. The Adult Basic Education program is designed to teach functionally illiterate adults to read.

In order to measure the total federal contributions to state and local educational expenditures, we have also included such other federal programs as Head Start, for disadvantaged preschool children; the larger institutional Manpower Development and Training Programs; the Teacher Corps; library material and supplementary education projects under Titles II and III of ESEA; and vocational education programs.

In Detroit, during the 1967-68 school year, $11.2 million of ESEA Title I funds assist only 31 percent of the eligible students. Adult Basic Education reaches slightly more than 2 percent of the eligible beneficiaries. Federal contributions to the Detroit public school system add about 10 percent to state and local expenditures. [191]

In Newark, during the 1967-68 school year, $4 million of ESEA Title I funds assist about 72 percent of the eligible students. The number of persons reached by the Adult Basic Education program is only approximately 6 percent of the number of functionally illiterate adults. Federal ,contributions to the Newark public school system add about 11 percent to state and local expenditures. [192]

In New Haven, during the 1967-68 school year, ESEA Title I funds in the amount of $992,000 assist only 40 percent of the eligible students in the middle and senior high schools. Although all eligible beneficiaries in 14 target elementary schools are aided, none of the eligible beneficiaries in 19 nontarget elementary schools are reached. Adult Basic Education reaches less than 4 percent of eligible beneficiaries. Federal contributions to the New Haven public school system add about 7 percent to state and local expenditures. [193]

Housing -- The major federal programs we have examined which are, at least in part, designed to affect the supply of low-income housing, include urban renewal, low rent public housing, housing for the elderly and handicapped, rent supplements, and FHA below market interest rate mortgage insurance (BMIR).

To measure the extent of need for low-income housing we have used the number of substandard and over-crowded units. [194] In measuring the size of housing programs, we have included expenditures for years prior to 1967 because they affected the low-income housing supply available in 1967.

In Detroit, a maximum of 758 low-income housing units have been assisted through these programs since 1956. This amounts to 2 percent of the substandard units and 1.7 percent of the overcrowded units. [195] Yet, since 1960, approximately 8,000 low income units have been demolished for urban renewal.

Similarly, in Newark, since 1959, a maximum of 3,760 low-income housing units have been assisted through the programs considered. This amounts to 16 percent of the substandard units and 23 percent of the overcrowded units. [196] During the same period, more than 12,000 families, mostly low-income, have been displaced by such public uses as urban renewal, public housing and highways.

In New Haven, since 1952, a maximum of 951 low-income housing units have been assisted through the programs considered. This amounts to 14 percent of the substandard units and 20 percent of the overcrowded units. [197] Yet since 1956, approximately 6,500 housing units, mostly low-income, have been demolished for highway construction and urban renewal.

Welfare -- We have considered four federally-assisted programs which provide monetary benefits to low-income persons: Old Age Assistance, Aid to the Blind, Aid to the Permanently and Totally Disabled, and Aid to Families with Dependent Children (AFDC). [198]

In Detroit, the number of persons reached with $48.2 million of federal funds through the four welfare programs during fiscal year 1967 was approximately 19 percent of the number of poor persons. [199] In Newark, the number of persons reached with $15 million was approximately 54 percent. [200] In New Haven, the number reached with $3.9 million was approximately 40 percent. [201]

Community Action Programs -- We have considered such community action programs as neighborhood service centers, consumer education, family counseling, low-cost credit services, small business development, legal services, programs for the aged, summer programs, home economics counseling, and cultural programs. [202]

In Detroit, the number of persons reached by $12.6 million of community action funds in 1967 was only about 30 percent of the number of poor persons. Federal funding of these programs averaged approximately $35 for each poor person. [203] In Newark, the number of persons reached by $1.9 million was about 44 percent. Federal funding of these programs averaged approximately $21 for each poor person. [204] In New Haven, the number reached by $2.3 million was approximately 42 percent. Federal funding averaged approximately $72 for each poor person. [205]

Grievances

To measure the present attitudes of people in the riot cities as precisely as possible, we are sponsoring two attitude surveys among Negroes and whites in 15 cities and four suburban areas, including four of the 20 cities studied for this chapter. These surveys are to be reported later.

In the interim we have attempted to draw some tentative conclusions based upon our own investigations and the more than 1200 interviews which we conducted relatively soon after the disorders. [206]

In almost all the cities surveyed, we found the same major grievance topics among Negro communities -- although they varied in importance from city to city. The deepest grievances can be ranked into the following three levels of relative intensity:

First Level of Intensity

1. Police practices

2. Unemployment and underemployment

3. Inadequate housing

Second Level of Intensity

4. Inadequate education [207]

5. Poor recreation facilities and programs [208]

6. Ineffectiveness of the political structure and grievance mechanisms

Third Level of Intensity

7. Disrespectful white attitudes

8. Discriminatory administration of justice

9. Inadequacy of federal programs

10. Inadequacy of municipal services [209]

11. Discriminatory consumer and credit practices [210]

12. Inadequate welfare programs

Our conclusions for the 20 cities have been generally confirmed by a special interview survey in Detroit sponsored by the Detroit Urban League. [211]

Police practices were, in some form, a significant grievance in virtually all cities and were often one of the most serious complaints. [212] Included in this category were complaints about physical or verbal abuse of Negro citizens by police officers, the lack of adequate channels for complaints against police, discriminatory police employment and promotion practices, a general lack of respect for Negroes by police officers, and the failure of police departments to provide adequate protection for Negroes.

Unemployment and underemployment were found to be grievances in all 20 cities and also frequently appeared to be one of the most serious complaints. [213] These were expressed in terms of joblessness or inadequate jobs and discriminatory practices by labor unions, local and state governments, state employment services and private employment agencies.
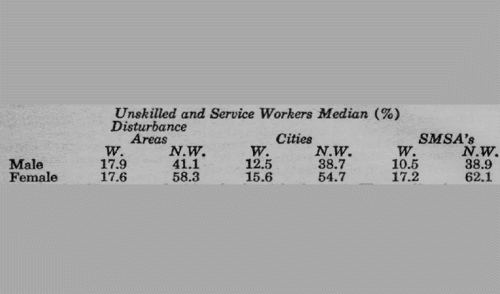
Housing grievances were found in almost all of the cities studied and appeared to be one of the most serious complaints in a majority of them. [214] These included inadequate enforcement of building and safety codes, discrimination in sales and rentals, and overcrowding.

The educational system was a source of grievance in almost all the 20 cities and appeared to be one of the most serious complaints in half of them. [215] These grievances centered on the prevalence of de facto segregation, the poor quality of instruction and facilities, deficiencies in the curriculum in the public schools (particularly because no Negro history was taught), inadequate representation of Negroes on school boards, and the absence or inadequacy of vocational training.

Grievances concerning municipal recreation programs were found in a large majority of the 20 cities and appeared to be one of the most serious complaints in almost half. [216] Inadequate recreational facilities in the ghetto and the lack of organized programs were common complaints.

The political structure was a source of grievance in almost all of the cities and was one of the most serious complaints in several. [217] There were significant grievances concerning the lack of adequate representation of Negroes in the political structure, the failure of local political structures to respond to legitimate complaints and the absence of obscurity of official grievance channels.

Hostile or racist attitudes of whites toward Negroes appeared to be one of the most serious complaints in several cities. [218]

In three-quarters of the cities there were significant grievances growing out of beliefs that the courts administer justice on a double, discriminatory standard, and that a presumption of guilt attaches whenever a policeman testifies against a Negro. [219]

Significant grievances concerning federal programs were expressed in a large majority of the 20 cities, but appeared to be one of the most serious complaints in only one. [220] Criticism of the federal anti-poverty programs focused on insufficient participation by the poor, lack of continuity, and inadequate funding. Other significant grievances involved urban renewal, insufficient community participation in planning and decision-making, and inadequate employment programs.

Services provided by municipal governments -- sanitation and garbage removal, health and hospital facilities, and paving and lighting of streets -- were sources of complaint in approximately half of the cities, but appeared to be one of the most serious grievances in only one. [221]

Grievances concerning unfair commercial practices affecting Negro consumers were found in approximately half of the cities, but appeared to be one of the most serious complaints in only two. [222] Beliefs were expressed that Negroes are sold inferior quality goods (particularly meats and produce) at higher prices and are subjected to excessive interest rates and fraudulent commercial practices.

Grievances relating to the welfare system were expressed in more than half of the 20 cities, but were not among the most serious complaints in any of the cities. There were complaints related to the inadequacy of welfare payments, "unfair regulations," such as the "man in the house" rule, which governs welfare eligibility, and the sometimes hostile and contemptuous attitude of welfare workers. The Commission's recommendations for reform of the welfare system are based on the necessity of attacking the cycle of poverty and dependency in the ghetto.

CHART 1: PERVASIVENESS OF GRIEVANCES. Grievances Found and Number of Cities Where Mentioned as Significant

Image

Image

Image

Image

Image

V. THE AFTERMATH OF DISORDER

"We will all do our best for a peaceful future together."

"Next time we'll really get the so and so's."

"It won't happen again."

"Nothing much changed here -- one way or the other."


We have sought to determine whether any of these expressions accurately characterizes events in the immediate aftermath of the 20 surveyed disorders. We are conducting continuing studies of the post-disorder climate in a number of cities. [223] But we have sought to make a preliminary judgment at this point. To do so, we considered:
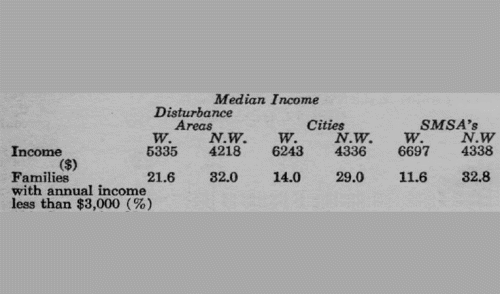
• Changes in Negro and white organizations;
• Official and civic responses to the social and economic conditions and grievances underlying the disorders;
• Police efforts to increase capacity to control future outbreaks;
• Efforts to repair physical damage.

From our surveys of the events of the immediate aftermath, we conclude that:

• The most common reaction was characterized by the last of the quoted expressions -- "nothing much changed";
• The status quo of daily life before the disorder was quickly restored;
• Despite some notable public and private efforts, particularly regarding employment opportunities, little basic change took place in the conditions underlying the disorder;
• In some cities disorder recurred within the same summer; [224] In several cities, the principal official response was to train and equip the police and auxiliary law enforcement agencies with more sophisticated weapons;
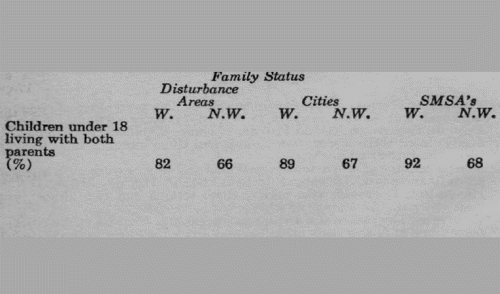
• In several cities, Negro communities sought to develop greater unity to negotiate with the larger community and to initiate self-help efforts in the ghetto;
• In several cities, there has been increased distrust between blacks and whites, less interracial communication, and growth of white segregationist or black separatist groups.

Often several of these developments occurred simultaneously within a city.

Detroit provides a notable example of the complexity of post-disorder events. Shortly after the riot, many efforts to ameliorate the grievances of ghetto residents and improve interracial communication were announced and begun by public and private organizations. The success of these efforts and their reception by the Negro community were mixed. More recently, militant separatist organizations of both races appear to be growing in influence.

Some of the most significant of the post-riot developments were:

Official and Other Community Actions

The New Detroit Committee (NDC), organized under the c0- sponsorship of the Mayor of Detroit and the Governor of Michigan, originally had a membership ranging from top industrialists to leading black militant spokesmen. NDC was envisioned as the central planning body for Detroit's rejuvenation.

However, it had an early setback last fall when the state legislature rejected its proposals for a statewide fair housing ordinance and for more state aid for Detroit's schools.

In January, 1968 NDC's broad interracial base was seriously weakened when black militant members resigned in a dispute over the conditions set for a proposed NDC-supported grant of $100,000 to a black militant organization.

To deal with the employment problem, the Ford Motor Company and other major employers in Detroit promised several thousand additional jobs to Detroit's hard-core unemployed. At least 55,000 persons were hired by some 17 firms. Ford, for example, established two employment offices in the ghetto. Reports vary on the results of these programs.

Steps taken to improve education after the riot include the appointment of Negroes to seven out of eighteen supervisory positions in the Detroit school system. Before the summer of 1967 none of these positions was held by a Negro. Michigan Bell Telephone Company announced that it would "adopt" one of Detroit's public high schools and initiate special programs in it.

Detroit's school board failed to obtain increased aid from the state legislature and announced plans to bring a novel suit against the state to force higher per capita aid to ghetto schools.

There are signs of increased hostility toward Negroes in the white community. One white extremist organization reportedly proposes that whites arm themselves for the holocaust it prophesies. A movement to recall the mayor has gained strength since the riot, and its leader has also pressed to have the fair housing ordinance passed by the Detroit Common Council put to a referendum.

The police and other law enforcement agencies in Detroit are making extensive plans to cope with any future disorder. The mayor has proposed to the Common Council the purchase of some $2 million worth of police riot equipment, including tanks, armored personnel carriers, and Stoner rifles (a weapon which fires a particularly destructive type of bullet).

Negro Community Action

A broadly-based Negro organization, the City-Wide Citizens Action Committee (CCAC), was formed after the riot by a leading local militant and originally included both militant and moderate members. It stresses self-determination for the black community. For example, it is developing plans for Negro-owned cooperatives and reportedly has demanded Negro participation in planning new construction in the ghetto. CCAC lost some of its moderate members because it has taken increasingly militant positions, and a rival, more moderate Negro organization, the Detroit Council of Organizations, has been formed.

Post-Riot Incidents and Prospects for the Future

There appears to be a growing division between the black and white communities as well as within the black community itself. Some pawnshops and gun stores have been robbed of firearms, and gun sales reportedly have tripled since the riot. In late 1967 there was a rent strike, reports of some fire bombings, and a new junior high school was seriously damaged by its predominantly Negro student body.

Many Negroes interviewed rejected the theory that the 1967 riot immunized Detroit against further disorders. Some believed that a new disturbance may well be highly organized and therefore much more serious.

Changes in Negro and White Organizations

In half the cities surveyed, new organizations concerned with race relations were established or old ones revitalized. No clear trend is apparent.

In a few cities the only apparent changes have been the increased influence of Negro militant separatist or white segregationist groups. [225]

In a few cities the organizations identified tended to follow more moderate and integrationist policies. [226] A youthful Negro who emerged as a leader during the riot in Plainfield started a new organization which, though militant, is cooperating with and influencing the established, more moderate Negro leadership in the city.

And in a few cities, organizations of white segregationists, Negro militants and moderate integrationists all emerged following the disturbances. In Newark, as in Detroit, both black and white extremist organizations have been active, as well as a prominent integrationist post-riot organization, the Committee of Concern. The committee was formed immediately after the riot and includes leading white businessmen, educators and Negro leaders. At the same time, leading black militants reportedly gained support among Negro moderates. And a white extremist group achieved prominence -- but not success -- in attempting to persuade the city council to authorize the purchase of police dogs. [227]

Official and Civic Response

Actions to ameliorate Negro grievances in the 20 cities surveyed were limited and sporadic. With few exceptions, these actions cannot be said to have contributed significantly to reducing the level of tension.

POLICE-COMMUNITY RELATIONS

In eight of the cities surveyed municipal administrations took some action to strengthen police-community relations. [228] In Atlanta, immediately after the riot, residents of the disturbance area requested that all regular police patrols be withdrawn because of hostility caused during the riot, when a resident was killed allegedly by policemen. The request was granted, and for a time the only officers in the area were police-community relations personnel. In Cincinnati, however, a proposal to increase the size of the police-community relations unit and to station the new officers in precinct stations has received little support.

EMPLOYMENT

Public and private organizations, often including business and industry, made efforts to improve employment opportunities in nine of the cities. [229]

In Tucson, a joint effort by public agencies and private industry produced 125 private and 75 city jobs. Since most of the city jobs ended with with the summer, some companies sought to provide permanent employment for some of those who had been hired by the city.

HOUSING

In nine cities surveyed, municipal administrations increased their housing programs. [230] In Cambridge. the Community Relations Commission supported the application of a local church to obtain federal funds for low and moderate income housing. The Commission also tried to interest local and national builders in constructing additional low-cost housing.

The Dayton city government initiated a program of concentrated housing code enforcement in the ghetto. The housing authority also adopted a policy of dispersing public housing sites and, at the request of Negroes, declared a moratorium on any new public housing in the predominantly Negro West Dayton area.

But in Newark, municipal and state authorities continued to pursue a medical center project originally designed to occupy up to 150 acres in the almost all-Negro Central Ward. The project, bitterly opposed by Negroes before the riot, would have required massive relocation of Negroes and was a source of great tension in the Negro community. However, with the persistent efforts of federal officials (HUD and HEW), an accommodation appears to have been reached on the issue recently, with reduction of the site to approximately 58 acres.

Private organizations attempted to improve the quality of ghetto housing in at least three of the cities surveyed. A Catholic charity in New Jersey announced a plan to build or rehabilitate 100 homes in each of five cities, including three of the cities surveyed (Elizabeth, Jersey City and Newark) and to sell the homes to low-income residents. The plan received substantial business backing. [231]

EDUCATION

In five of the cities surveyed, local governments have taken positive steps to alleviate grievances relating to education. [232] In Rockford, residents approved a bond referendum to increase teacher salaries, build schools and meet other needs. A portion of this money will be used, with matching state and federal funds, to construct a vocational and technical center for secondary schools in the Rockford area.

In two cities, private companies made substantial contributions to local school systems. The Standard Oil Company of New Jersey donated to the Elizabeth school board a building valued at $500,000 for use as an administrative center and for additional classrooms. [233]

However, in four of the cities surveyed, there were increased grievances concerning education. [234] In Cincinnati recent elections resulted in the election of two new board of education members who belonged to a taxpayers' group which had twice in 1966 successfully opposed a school bond referendum. Also, racial incidents in the Cincinnati schools increased dramatically in number and severity during the school year.

RECREATION

In four cities, programs have been initiated to increase recreational facilities in ghetto communities. [235] A month and a half after the New Brunswick disturbances, local businessmen donated five portable swimming pools to the city. A boat which the city will use as a recreation center was also donated and towed to the city by private companies.
admin
Site Admin
 
Posts: 36230
Joined: Thu Aug 01, 2013 5:21 am

Re: Report of the National Advisory (Kerner Report 1967)

Postby admin » Mon May 02, 2016 9:19 am

Part 3 of 5

NEGRO REPRESENTATION

The elections of Negro mayors in Cleveland -- which experienced the Hough riot in 1966 -- and Gary have been widely interpreted as significant gains in Negro representation and participation in municipal political structures. In five of the six surveyed cities which have had municipal elections since the 1967 disturbances, however, there has been no change in Negro representation in city hall or in the municipal governing body. [236] In New Haven, the one city where there was change, the result was decreased Negro representation on the board of aldermen from five out of 35 to three out of 30.

Changes toward greater Negro representation occurred in three other cities in which Negroes were selected as president of the city council and as members of a local civil service commission, a housing authority and a board of adjustments. [237]

GRIEVANCE MACHINERY

There was a positive change in governmental grievance channels or procedures in two cities. [238] But in one case, an effort to continue use of counter-rioters as a communications channel was abandoned. [239]

FEDERAL PROGRAMS

There are at least ten examples, in eight cities, of federal programs being improved or new federal programs being instituted [240]; in two cities disputes have arisen in connection with federally-assisted programs. [241]

MUNICIPAL SERVICES

Four cities have tried to improve municipal services in disturbance areas. [242] In Dayton, the city began a program of additional garbage collection and alley cleaning in the disturbance area. In Atlanta, on the day after the disturbance ended, the city began replacing street lights, repaving streets and collecting garbage frequently in the disturbance area. However, the improved services were reportedly discontinued after a month and a half.

OTHER PROGRAMS

In one city, a consumer education program was begun. [243] In none of the 20 cities surveyed were steps taken to improve welfare programs. In two of the surveyed cities, plans were developed to establish new businesses in disturbance areas. [244]

Capacity to Control Future Disorders

Five of the surveyed cities planned to improve police control capability in the event of disorder. [245] Four cities developed plans for using counter-rioters, [246] but in one case the plans were later abandoned. [247] In Detroit, plans were made to improve the administration of justice in the event of future disorder by identifying usable detention facilities and assigning experienced clerks to process arrestees.

Repair of Physical Damage

Significant numbers of businessmen in the riot areas have reopened in several cities where damage was substantial. In Detroit, none of the businesses totally destroyed in the riot have been rebuilt, but many which suffered only minor damage have reopened. In Newark, 83 percent of the damaged businesses have reopened, according to official estimates. [248] In Detroit, the only city surveyed which suffered substantial damage to residences, there has been no significant residential rebuilding.

In two cities, Negro organizations insisted on an active role in decisions about rehabilitation of the disturbance area. [249]

NOTES TO CHAPTER 2

In many of these footnotes where a series of disorders is mentioned we have indicated the number of disturbances which have been classified as "major," "serious" or "minor" in the section on "Levels of Violence and Damage" in Chapter 2-1 supra.

FOOTNOTES TO CHAPTER 2-I

1. Five sources for our compilation were: Department of Justice, Criminal Division; Federal Bureau of Investigation;. U.S. Commission on Civil Rights; Lemberg Center for the Study of Violence, Brandeis University; and Congressional Quarterly, September 8, 1967.

2. Buffalo, N. Y.

Cincinnati, Ohio (June)
Detroit, Mich.
Milwaukee, Wis.
Minneapolis, Minn.
Newark, N.J.
Plainfield, N.J.
Tampa, Fla. (June)

3. Albany, N.Y.

Atlanta, Ga. (June)
Birmingham, Ala.
Boston, Mass.
Cairo, Ill.
Cambridge, Md. (July)
Cincinnati, Ohio (July 3-5)
Dayton, Ohio (June)
Flint, Mich.
Fresno, Calif.
Grand Rapids, Mich.
Houston, Texas (May)
Jackson, Miss.
Montclair, N.J.
Nashville, Tenn.
New Haven, Conn.
New York, N.Y. (Bronx and E. Harlem)
Omaha, Nebr.
Paterson, N.J.
Phoenix, Ariz.
Pontiac, Mich.
Portland, Ore.
Riviera Beach, Fla.
Rochester, N.Y. (July)
Saginaw, Mich.
San Francisco, Calif. (May 14-15, July)
Syracuse, N.Y.
Toledo, Ohio
Waterloo, Iowa
Wichita, Kan. (August)
Wilmington, Del.

4. Alton, Ill.

Asbury Park, N.J.
Atlanta, Ga. (July)
Aurora, Ill.
Benton Harbor, Mich.
Bridgeport, Conn.
Bridgeton, N.J.
Cambridge, Md. (June)
Chicago, Ill. (4 disorders)
Cincinnati, Ohio (July 27)
Clearwater, Fla.
Cleveland, Ohio (2 disorders)
Columbus, Ohio
Dayton, Ohio (September)
Deerfield Beech, Fla. (2 disorders)
Denver, Colo. (2 disorders)
Des Moines, Iowa (2 disorders)
Durham, N.C.
East Orange, N.J. (2 disorders)
E. Palo Alto, Calif.
East St. Louis, Ill. (2 disorders)
Elgin, Ill. (2 disorders)
Elizabeth, N.J.
Englewood, N.J.
Erie, Penn. (2 disorders)
Greensboro, N.C.
Hamilton, Ohio
Hammond, La.
Hartford, Conn. (3 disorders)
Houston, Texas (July, August)
Irvington, N.J.
Jackson, Mich.
Jamesburg, N.J.
Jersey City, N.J.
Kalamazoo, Mich.
Kansas City, Mo.
Lackawanna, N.Y.
Lakeland, Fla.
Lansing, Mich.
Lima, Ohio
Long Beach, Calif.
Lorain, Ohio
Los Angeles, Calif.
Louisville, Ky.
Marin City, Calif.
Massillon, Ohio
Maywood, Ill. (2 disorders)
Middletown, Ohio
Mt. Clemens, Mich.
Mt. Vernon, N.Y.
Muskegon, Mich.
New Britain, Conn.
New Brunswick, N.J.
Newburgh, N.Y.
New Castle, Penn.
New London, Conn.
New Rochelle, N.Y.
New York, N.Y. (Fifth Avenue and 2 Brooklyn disorders)
Niagara Falls, N.Y.
Nyack, N.Y. (2 disorders)
Oakland, Calif.
Orange, N.J.
Pasadena, Calif.
Passaic, N.J.
Peekskill, N.Y.
Peoria, Ill.
Philadelphia, Penn. (3 disorders)
Pittsburgh, Penn.
Poughkeepsie, N.Y.
Prattville, Ala.
Providence, R.I.
Rahway, N.J.
Rochester, N.Y. (May 31-June 1)
Rockford, Ill. (2 disorders)
Sacramento, Calif.
St. Louis, Mo.
St. Paul, Minn.
St. Petersburg, Fla.
San Bernardino, Calif.
San Diego, Calif.
Sandusky, Ohio
San Francisco, Calif. (May 21)
Seaford, Del.
Seattle, Wash.
South Bend, Ind.
Springfield, Ohio
Spring Valley, N.Y.
Tampa, Fla. (July)
Texarkana, Ark.
Tucson, Ariz.
Vallejo, Calif. (2 disorders)
Wadesboro, N.C.
Washington, D.C.
Waterbury, Conn.;
Waukegan, Ill.
West Palm Beach, Fla.
Wichita, Kansas (May and July)
Wyandanch, N.Y.
Youngstown, Ohio
Ypsilanti, Mich.

5. Three:

Cincinnati
Hartford
Houston
Philadelphia
San Francisco
Wichita
Two:
Atlanta
Cambridge
Cleveland
Dayton
Deerfield Beach
Denver
Des Moines
East Orange
East St. Louis
Elgin
Erie
Maywood
Nyack
Rochester
Rockford
Tampa
Vallejo

6. Cleveland and Rochester.

7. Disorders were counted in the month in which they began. Thus the Omaha disorder, for example, which began on March 31 and ended on April 2, was counted in the March total.

January: Chicago
March: Omaha
April: Cleveland, Louisville, Massillon and Nashville.
May: Two in Chicago, Houston, Jackson (Miss.) Philadelphia, Rochester, San Diego, two in San Francisco, Vallejo and Wichita.
June: Atlanta, Boston, Buffalo, Cambridge, Cincinnati, Clearwater, Dayton, Lansing, Los Angeles, Maywood, Middletown, Niagara Falls, Philadelphia, Prattville, St. Petersburg and Tampa.

July:

Albany
Alton
Asbury Park
Atlanta
Benton Harbor
Birmingham
Bridgeport
Bridgeton
Cairo
Cambridge
Chicago
Cincinnati (2)
Cleveland
Deerfield Beach
Denver
Des Moines (2)
Detroit
Durham
E. Orange (2)
E. Palo Alto
E. St. Louis
Elgin
Englewood
Erie (2)
Flint
Fresno
Greensboro
Grand Rapids
Hamilton
Hartford
Houston
Irvington
Jersey City
Kalamazoo
Kansas City
Lackawanna
Lakeland
Lima
Long Beach
Lorain
Marin City
Maywood
Milwaukee
Minneapolis
Montclair
Mt. Clemens
Mt. Vernon
Muskegon
Newark
New Britain
New Brunswick
Newburgh
New Castle
New Rochelle
New York (4)
Nyack
Oakland
Orange
Pasadena
Pasaaic
Paterson
Peekskill
Philadelphia
Phoenix
Plainfield
Pontiac
Portland
Poughkeepsie
Providence
Rahway
Riviera Beach
Rochester
Rockford (2)
Sacramento
Saginaw
St. Paul
San Bernardino
San Francisco
Seaford
Seattle
South Bend
Springfield
Tampa
Toledo
Tucson
Wadesboro
Waterbury
Waterloo
Waukegan
W. Palm Beach
Wichita
Wilmington
Youngstown
Ypsilanti

August:

Denver
Elgin
Hammond
Houston
Jackson (Mich.)
Jamesburg
New Haven
Peoria
Pittsburgh
St. Louis
Sandusky
Spring Valley
Syracuse
Vallejo
Washington
Wichita
Wyandanch
September:
Aurora
Columbus
Dayton
Deerfield Beach
East St. Louis
Hartford (2)
New London
New York
Nyack
Texarkana

8. East:

Albany
Asbury Park
Boston
Bridgeport
Bridgeton
Buffalo
E. Orange (2)
Elizabeth
Englewood
Erie (2)
Hartford (3)
New Haven
Irvington
Jamesburg
Jersey City
Lackawanna
Montclair
Mt. Vernon
Newark
New Britain
New Brunswick
Newburg
New Castle
New London
New Rochelle
New York (5)
Niagara Falls
Nyack (2)
Orange
Passaic
Paterson
Peekskill
Philadelphia (3)
Pittsburgh
Plainfield
Poughkeepsie
Providence
Rahway
Rochester (2)
Seaford
Spring Valley
Syracuse
Waterbury
Wilmington
Wyandanch

Midwest:

Alton
Aurora
Benton Harbor
Cairo
Chicago (4)
Cleveland (2)
Cincinnati (3)
Columbus
Dayton (2)
Dee Moines (2)
Detroit
E. St. Louis (2)
Elgin (2)
Flint
Grand Rapids
Hamilton
Jackson (Mich.)
Kalamazoo
Kansas City
Lansing
Lima
Lorain
Massillon
Maywood (2)
Middletown
Milwaukee
Minneapolis
Mt. Clemens
Muskegon
Omaha
Peoria
Pontiac
Rockford (2)
Saginaw
St. Louis
St. Paul
Sandusky
South Bend
Springfield
Toledo
Waterloo
Waukegan
Wichita (3)
Youngstown
Ypsilanti
South and Border States:
Atlanta (2)
Birmingham
Cambridge (2)
Clearwater
Deerfield Beach (2)
Durham
Greensboro
Hammond
Houston (3)
Jackson (Miss.)
Lakeland
Louisville
Nashville
Prattville
Riviera Beach
St. Petersburg
Tampa (2)
Texarkana
Wadesboro
W. Palm Beach
Washington

West:

Denver (2)
E. Palo Alto
Fresno
Long Beach
Los Angeles
Marin City
Oakland
Pasadena
Phoenix
Portland
Sacramento
San Bernardino
San Diego
San Francisco (3)
Seattle
Tucson
Vallejo (2)

9. Newark: Plainfield, Paterson, Orange, Irvington. E. Orange, Rahway, Montclair, Elizabeth, Asbury Park, Jersey City, New Brunswick, Nyack, Bridgeton and Englewood.

Detroit: Kalamazoo, Pontiac, Toledo, Flint, Grand Rapids, Muskegon, Saginaw and Mt. Clemens.

The causal relationship between the Detroit and Newark riots and the disorders in their respective clusters is considered under Precipitating Incidents in Part II of this chapter.

The other 21 clusters, arranged by the month in which each cluster began, were:

April: Cleveland, Massillon
Nashville, Louisville

May: San Francisco, Vallejo

June: Cincinnati, Dayton, Middletown
Buffalo, Niagara Falls
Clearwater, Tampa, St. Petersburg

July: Tampa, Deerfield Beach, Lakeland, Riviera Beach, W. Palm Beach
Greensboro, Durham, Wadesboro
Bronx, E. Harlem, New York 5th Avenue, Mt. Vernon, Brooklyn, Peekskill, Lackawanna, Newburgh Passaic, Poughkeepsie, New Rochelle, New Britain, Bridgeport, Waterbury
Rochester, Albany
Philadelphia, Wilmington
Des Moines, Waterloo, Des Moines
Minneapolis, St. Paul
Youngstown, Lima, Cleveland
Lorain, Springfield, Cincinnati, Hamilton, Sandusky
Waukegan, Chicago, South Bend, Elgin, Rockford, Peoria
Tucson, Phoenix
Sacramento, San Francisco, Oakland
E. Palo Alto, Long Beach, San Bernardino, Pasadena

August: New Haven, New London, Hartford

September: Dayton, Columbus


10. This table is based upon the estimated 1967 population of the 128 cities except for New York and Hartford, for which 1966 estimates were used, and 15 cities for which 1960 census figures were used (Deerfield Beach, East Orange, Englewood, Irvington, Lackawanna, Maywood, Montclair, Orange, Prattville, Rahway, Riviera Beach, Seaford, Spring Valley, Wadesboro and Waterloo).

11. Figures were unavailable for four communities (East Palo Alto, Jamesburg, Marin City and Wyandanch).

12. See Hearings before the Permanent Subcommittee on Investigations of the Senate Committee on Government Operations, Riots, Civil and Criminal Disorders, 90th Cong., 1st Seds., Part I, insert facing p. 14.

More recent date indicate that there were 23 riot-related deaths in Newark rather than 25 as reported by the Subcommittee. There are similar variations for some cities with regard to the number injured. In addition, Atlanta, in which there were one death and at least nine injuries, was not included in the Subcommittee's list. Finally, two of the disturbances included in the Subcommittee's figures are not in our list of 164 disorders (Hattiesburg, Miss. -- no deaths, five injuries; Montgomery, Ala. -- no deaths, no injuries).

13. In 12 (16 percent) of the disturbances studied by the Permanent Subcommittee there were deaths. Sixty-eight (82 percent) of the deaths and 1,049 (56 percent) of the injuries occurred in two (3 percent) of the disturbances.

According to figures of the Permanent Subcommittee, Detroit experienced 43 deaths and 324 injuries; Newark experienced 25 deaths and 725 injuries.

In six (8 percent) of the disturbances, there were one to four deaths and 11 to 65 injuries reported:

City / Deaths / Injuries

Cincinnati (6/12-18) / 1 / 63
Jackson / 1 / 43
Milwaukee / 4 / 44*
New York (7/23-25) / 2 / 45
New York (i/4-8) / 1 / 58
Plainfield / 1 / 55

* This figure represents only injuries to "Law Officers." No figure was reported for injuries to civilians.


Image

In four (5 percent) of the disturbances, there were one to two deaths and one to ten injuries reported:

City / Deaths / Injuries

Erie (7/18-20) / 1/ 6
Houston (5/16-17) / 1 / 6
Pontiac / 2 / 2
Rochester / 1 / 9


In 46 (61 percent of the disturbances, there were injuries but no deaths reported. In 15 (20 Percent) of the disturbances, there were no deaths and 11 to 60 injuries:

City / Injuries

Birmingham / 11
Boston / 60
Buffalo / 15
Grand Rapids / 26
Hartford / 18
Nashville / 17
New York (7/24-8/3) / 11
New York (7/29-31) / 58
Providence / 45
Sacramento / 16
San Francisco (5/14-15) / 33
San Francisco (7/26-31) / 16
Tampa / 16
Wichita / 23
Wilmington / 13


In 31 (41 percent) of the disturbances, there were no deaths and from one to ten injuries:

City / Injuries

Cambridge / 2
Cincinnati (7/3-4) / 1
Cincinnati (7/27-28) / 3
Englewood / 9
Erie (7/31-8/3) / 6
Fresno 2
Greensboro / 2
Hamilton / 1
Hattiesburg / 5
Kalamazoo / 6
Long Beach / 6
Massillon / 5
Minneapolis / 5
Mt. Vernon / 10
New Britain / 5
New Haven / 3
Passaic / 4
Peoria / 4
Phoenix / 8
Portland / 1
Poughkeepsie / 5
Rockford / 4
Saginaw / 10
San Bernardino / 2
South Bend / 5 [*]
Syracuse / 7
Toledo / 6
Tucson / 8
Waterbury / 3
Waterloo / 3
West Palm Beach / 1

* This figure represents only injuries to "Law Officers." No figure was reported for injuries to civilians.


In 17 (23 percent) of the disturbances, there were no injuries and no deaths reported:

Albany
Chicago
Dayton (6/14-15)
Elgin
Flint
Houston (8/15-17)
Kansas City
Lima
Louisville
Montgomery
Mt. Clemens
Omaha
Paterson
Peekskill
Riviera Beach
Washington
Wyandanch

14. Atlanta
Bridgeton
EIizabeth
Jersey City
New Brunswick
Paterson
Phoenix
Rockford
Tucson

15. The Detroit Fire Department has listed 682 riot-connected building fires. Of these, 412 buildings were completely demolished. The Cincinnati Fire Department has estimated over $1 million in damage from riot-connected fires during the June disturbance.

16. Of 250 fires during a six-day period, only 13 were considered serious by Newark authorities. In no case did a fire spread from its original source to other areas.

More than $8 million of the loss in Newark was attributed to loss of inventory due to looting and damage to stock. Of the 889 business establishments damaged, 25 (3 percent) were demolished and 136 (15 percent) were heavily damaged. Damage to glass, fixtures and buildings was estimated at $1,976,140.

17. On August 15, 1967, it was reported that the State Insurance Commission estimated the property loss at $144 million and that the Detroit Fire Department's estimate was closer to $200 million, only $84 million of which was insured. A December, 1967, estimate by the State Insurance Commission was between $40 million and $45 million. The Insurance Commission indicated that almost $33 million will be covered by insurance.

18. The City of Detroit incurred over $5 million in extraordinary expenses, more than $3 million of which was for personnel costs. In Cincinnati, a disorder of one week cost three city departments more than $300,000 in extraordinary expenditures, principally for overtime for police and firemen.

19. In Detroit at least 274 families were displaced by the destruction of their homes.

20. Seventy-four (89 percent) of the persons reported killed were civilians. The person killed in Atlanta was also a civilian. Of the 1,897 persons reported injured, 1,185 (62 percent) were civilians and 712 (38 percent) were law officers.

21. Cincinnati
Dayton
Englewood
Newark
New Brunswick
New Haven
Paterson
Plainfield
Tampa

22. The Governor's Select Commission on Civil Disorder of the State of New Jersey has found that police forces purposely damaged Negro-owned stores during the Newark riot. The Commission said:

The damage caused within a few hours early Sunday morning, July 16, to a large number of stores marked with "Soul" signs to depict non-white ownership and located in a limited area reflects a pattern of police action for which there is no possible justification. Testimony strongly suggests that State Police elements were mainly responsible with some participation by National Guardsmen.

Governor's Select Commission on Civil Disorder, State of New Jersey, Report for Action, February 1968, p. 304.

23. In at least three of the cities (Detroit, Newark and Plainfield) there was damage to police and/or fire stations. In Cambridge, a public elementary school building was burned. In two of the university settings, school buildings were damaged. There was extensive damage to two dormitories at Texas Southern University in Houston. The bulk of this damage was allegedly caused by police gunfire and subsequent searches of the buildings. At privately-owned Fisk University in Nashville, a plate glass door was broken. It is unclear whether this was done by police or students.

24. Atlanta
Cincinnati
Dayton
Detroit
Elizabeth
Englewood
Grand Rapids
Houston
Jackson
New Haven
Newark
Phoenix
Plainfield
Rockford
Tucson

25. Cambridge
Elizabeth
Englewood
Nashville
New Haven
Newark
Rockford
Tampa
Tucson

Other types of property damage included private cars, buses, and delivery trucks in at least 11 of the 23 cities studied.

Cambridge
Cincinnati
Dayton
Grand Rapids
Jersey City
Nashville
Newark
Phoenix
Plainfield
Tampa
Tucson
admin
Site Admin
 
Posts: 36230
Joined: Thu Aug 01, 2013 5:21 am

Re: Report of the National Advisory (Kerner Report 1967)

Postby admin » Mon May 02, 2016 9:19 am

Part 4 of 5

FOOTNOTES TO CHAPTER 2-II

26. The 20 cities were Atlanta, Bridgeton, Cambridge, Cincinnati (the June disorder), Dayton (the June and September disorders), Detroit, Elizabeth, Englewood, Grand Rapids, Jersey City, Milwaukee, New Brunswick, Newark, New Haven, Paterson, Phoenix, Plainfield, Rockford, Tampa and Tucson.

The three university settings were Houston, Texas (Texas Southern University). Jackson, Mississippi (Jackson State College) and Nashville, Tennessee (Fisk University and Tennessee A. & I. State College).

See Statement on Methodology. Appendix, for a description of our survey procedures.

FOOTNOTES TO CHAPTER 2-II

Reservoir of Grievances in the Negro Community  

27. See Part IV, THE BACKGROUND OF DISORDER, infra; and Part III, THE RIOT PARTICIPANT, infra.

FOOTNOTES TO CHAPTER 2-II -- PRECIPITATING INCIDENTS

28. A final incident was identifiable preceding all 24 surveyed disorders except Rockford. See Section II, "The Development of Violence," infra, for the time and place of each final incident and the outbreak of violence.

29. In our surveys at least 88 prior incidents were identified by Negro interviewees as having been widely known and remembered at the time of the outbreak of violence, as having been a source or exemplification of grievances, and as having contributed to the disorders. The number of such prior precipitating incidents in a given city cannot be stated with certainty. Different sources recalled different events or stressed different aspects of a single event. However, we have been able to identify multiple incidents in moat of the cities surveyed. Such incidents were reported in all except two cities (Elizabeth and Tucson; both minor).

At least 10 prior incidents were identified in Houston (serious); seven in Bridgeton (minor); six in Atlanta. Milwaukee and Nashville (one major, two serious); five in Cincinnati, Newark and Plainfield (all major); four in Cambridge and the June and September Dayton disorders (two serious, one minor); three in Detroit, Jersey City New Haven and Phoenix (one major, two serious and one minor); two in Englewood, Grand Rapids, Jackson, New Brunswick, Paterson, Rockford and Tampa (one major, three serious and three minor). Twenty-eight prior incidents occurred within a week preceding violence, nine occurred one month to one week prior, 36 occurred six months to one month prior, eleven occurred one year to six months prior to the violence. One year was used as an arbitrary time limit for counting incidents, except when the incident was identified as particularly significant to the disorder in that city. Four such incidents were identified: In Newark (the 1965 shooting of a Negro by police), in Jersey City (a disturbance in 1964), in Englewood (a 1962 disturbance), and in Cambridge (racial tensions necessitating the presence of National Guardsmen from 1963 to 1965).

30. See the section on "Grievances" in Part IV infra.

31. Such actions were identified as prior incidents in 35 cases preceding 18 disturbances (Atlanta, Bridgeton, Cincinnati, the June and September Dayton disturbances, Detroit, Englewood, Houston, Jersey City, Milwaukee, Nashville, New Brunswick, New Haven, Newark, Paterson, Plainfield, Rockford and Tampa; six major, six serious and six minor).

The percentages used for the frequency of the occurrence of type of incidents total more than 100 percent since a few incidents fell into more than one category.

32. Thirty-two incidents preceding all 18 disorders fit this pattern. Responses to a larger group constituted four incidents, all involving groups of demonstrators (Cincinnati, Nashville, and twice in Houston; one major and two serious).

33. Bridgeton, Cambridge, Detroit. Grand Rapids, Houston, Jackson, Milwaukee, Nashville, Newark, Phoenix, Tampa and Tucson (four major, six serious and two minor).

34. Cambridge and Houston (both serious). The incident in Cambridge occurred when police fired at a group of Negroes leaving a protest meeting, and in Houston when they arrested a Negro trying to address a group of demonstrators.

35. This was the case in 15 instances preceding nine disorders (Atlanta, Bridgeton, Cambridge, Houston, Milwaukee, Nashville, New Haven, Newark and Phoenix; two major and six serious).

36. This occurred in five cases preceding four disorders (Cambridge, the June Dayton disturbance, Houston and Nashville; all serious).

37. Atlanta and the June Dayton disturbance (both serious) featured nationally-known militants. Cincinnati, the September Dayton disturbance and Plainfield (two major and one minor) involved only local leaders.

38. Atlanta, Cincinnati and the September Dayton disturbance (one major, one serious and one minor).

39. The June Dayton and Plainfield disturbances (both serious).

40. This occurred in 15 cases preceding nine disturbances (Atlanta, Bridgeton, Cambridge, the June Dayton disorder, Detroit, Jackson, Milwaukee, Nashville and Tampa; three major, five serious, one minor).

41. Atlanta the June and September Dayton disturbance, Detroit, Englewood, Jersey City and Paterson (one major, three serious and three minor). The previous disorder counted in Detroit was the "Kercheval incident" in August of 1966 mentioned in the text of this section, and not the 1943 Detroit riot. In Dayton, the June 1967 disorder was counted as a prior incident in relation to the September disorder; four major, six serious and three minor).

42. Atlanta, Cincinnati, Grand Rapids, Houston, Jersey City, Milwaukee and Plainfield (three major, three serious and one minor).

43. Four such cases preceded four disorders (Bridgeton, Grand Rapids, Phoenix and Plainfield; one major, two serious and one minor).

44. Elizabeth, Englewood, Jersey City, New Brunswick and Paterson (one serious, four minor).

See Part I of this Chapter for a discussion of the patterns of the disorders in terms of timing and geographic distribution. The impact of communications media on the propagation of disorders is discussed in Chapter 15.

45. This was the case in nine or more instances preceding six disturbances (Bridgeton, Cincinnati, Jackson, Milwaukee, Newark and Plainfield; four major, one serious and one minor). The initial refusal to fund or the cancellation of funding by officials responsible for federally-financed antipoverty programs was included in this category. There were three cases preceding three disturbances (the June Dayton disorder, New Haven and Phoenix; all serious).

46. This was the case in eight instances preceding eight disorders (Cambridge, Cincinnati, the September Dayton disorder, Detroit, Houston, Milwaukee, New Brunswick, and Paterson; three major, three serious and two minor).

47. This incident was not included in the category of racist activities, since the shooting apparently was not motivated entirely by the victim's ethnic origin.

48. Bridgeton, Detroit, Houston, Milwaukee, Nashville, Newark and Tampa (four major, two serious and one minor).

49. Atlanta, Cincinnati and the September Dayton disturbance (one major and two serious).

Meetings to protest actions involved in prior incidents on the part of city officials other than the police were identified as the final incident preceding two disorders (the June Dayton disturbance and Plainfield; one major and one serious).

FOOTNOTES TO CHAPTER 2-II

Development of Violence


50. This is readily apparent from the charts annexed to this Report, which portray graphically the varying levels of violence during the period of each of the 24 disorders.

51. All except Bridgeton, Cambridge, Elizabeth, Jersey City, New Brunswick and New Haven (two serious and four minor disturbances). In eight of the 18 cases the estimated size of the groups ranged from 50 to 100 (the September Dayton disorder, Detroit, Grand Rapids, Houston, Jackson, Paterson, Phoenix and Plainfield; two major, five serious and one minor); in six cases from 100 to 200 (Cincinnati, the June Dayton disorder, Englewood, Nashville, Rockford and Tucson; one major, two serious and three minor): and in six cases from 200 to 1,000 (Atlanta, Houston, Jackson, Milwaukee, Newark and Tampa; three major and three serious).

52. Detroit, Englewood, Milwaukee, Nashville, New Haven, Paterson, Plainfield, Rockford, Tampa and Tucson (four major, three serious and three minor). Seven disorders began on Monday (Atlanta, Cambridge, Cincinnati, Elizabeth, Grand Rapids, Jersey City and New Brunswick; one major, three serious and three minor). Three began on Tuesday (the September Dayton disturbance, Houston and Phoenix: two serious and one minor), three on Wednesday (the June Dayton disturbance, Jackson and Newark; one major and two serious) and one Thursday (Bridgeton; minor).

53. Eighteen disorders for which temperature information was available occurred at the end of a day in which the temperature had reached a high of at least 79 degrees. In nine cases the temperature had reached 90 degrees or more during the day (Atlanta, Cambridge, Cincinnati, the June Dayton disturbance, Newark, Paterson, Phoenix, Tampa and Tucson; three major, five serious and one minor) in eight cases the temperature had been in the 80's (Detroit, Elizabeth, Englewood, Grand Rapids, Jersey City, New Brunswick, New Haven and Rockford: one major, two serious and five minor), and in one city the high temperature was 79 degrees (Milwaukee; a major disturbance).

54. See the annexed charts of levels of violence.

55. Ibid. Of New Haven's six cycles of violence, one occurred during early daylight hours and one began and reached its peak during the afternoon. In Plainfield (major) substantial violence began during one afternoon and continued, through a midnight peak, into the following day and evening. In Grand Rapids (serious) two cycles of violence occurred within one 24- hour period, one continuing into daylight hours and the other beginning in the afternoon.

56. In three disorders this was the pattern (Atlanta, Cambridge and Englewood; two serious and one minor). 1n a few cases these cycles were separated by one or more 24-hour periods in which little or no violence occurred, even during the first days of the disorder. Also see the charts annexed to this chapter.

57. Violence erupted within less than 30 minutes after the occurrence of the final incident in 11 disorders (Atlanta, Cincinnati, the June and September Dayton disturbances, Grand Rapids, Houston, Jackson, Milwaukee, Plainfield, Tampa and Tucson; four major, five serious and two minor).

In seven other disorders the violence erupted less than two hours after the occurrence of a final incident (Bridgeton, Cambridge, Detroit, Nashville, New Haven, Newark and Phoenix; two major, four serious and one minor). The time span between the final incident and the beginning of violence is not easily established for the disturbances in the five New Jersey cities in which the final incidents were reports of disorders in neighboring cities (Elizabeth, Englewood, New Brunswick, Jersey City and Paterson: one serious and four minor).

58. Violence in 11 disorders reached a peak for the first night, and in some cases an overall peak, in less than one hour after the initial outbreak (Atlanta, Bridgeton, the June and September Dayton disorders, Englewood, Milwaukee, Nashville, New Haven, Newark" Plainfield and Rockford; three major, five serious and three minor). In tour other disorders violence reached a first night peak in less than two hours (Jersey City, New Brunswick, Paterson and Tampa; one major, one serious and two minor), and in eight disorders violence reached a first night peak in less than five hours (Cambridge, Cincinnati, Elizabeth, Grand Rapids, Houston, Jackson, Phoenix and Tucson; one major, five serious and two minor). In one disturbance (Detroit: major), violence continued to escalate over a period of 12 to 15 hours after the initial outbreak.

59. See the annexed charts of levels of violence.

60. Ibid. All except the June and September Dayton disturbances, Elizabeth, Houston and New Brunswick (two serious and three minor).

61. Bridgeton, Cambridge, Cincinnati, Englewood, Grand Rapids, Jersey City, Milwaukee, Nashville, Tampa and Tucson (two major, five serious and three minor).

62. Atlanta, Detroit, Jackson, Newark, New Haven, Paterson, Plainfield and Rockford (three major, five serious and one minor). See the section on "The Control Effort," infra, for a further discussion of violence levels.

63. Of 34 reported occasions of rock and bottle-throwing, 26 occurred in the first two cycles of violence. Of 31 reported occasions of window-breaking, 24 occurred in the first two cycles.

64. Of 30 reported occasions of looting, 20 occurred in the first two cycles and 28 in the first three cycles.

65. Of 24 reported occasions of fire bombs and Molotov cocktails, 12 occurred in the first two cycles and 12 in the second two.

66. Of 26 reported occasion of fires, 18 occurred in the second and third cycles, and eight in the first and last.

67. Of 18 reported occasions, 13 occurred in the second and third cycles.

68. In only four instances did local police request and receive assistance in the initial response from an outside force (Bridgeton, Cambridge, Englewood and New Brunswick; one serious and three minor). In the case of Cambridge, the outside forces consisted of National Guardsmen, State police, and the county sheriff and constable. In the other three cases, they consisted of the police of neighboring towns or county or both.

69. In ten of the 24 disorders, this was the case (Atlanta, both Dayton disorders, Elizabeth, Houston, Jersey City, Nashville, Paterson, Phoenix and Tucson; six serious and four minor).

70. In a majority of cases for which we have such information, in 12 out of 22, the initial control force was either larger than the crowd on the street or no fewer than a ratio of one policeman to every five persons on the street (Bridgeton, Cambridge, both Dayton disorde18, Elizabeth, Englewood, Grand Rapids, Jersey City, New Brunswick, Paterson, Phoenix and Rockford; five serious and seven minor).

In one of these instances almost the entire police force of 900 men was moved in before a single rioter appeared on the streets (Jersey City: minor). In the remaining ten cases the ratio varied: from one policeman to every six persons on the street (New Haven; serious), to one policeman to 300 people on the street (Tampa; major). The median ratio In these ten cases was one policeman to 25 parsons on the street (Cincinnati Detroit, Houston, Jackson, Nashville, Newark, Plainfield, and Tucson; four major, three serious and one minor).

71. In at least one case, the police rushed at the crowd with nightsticks (Newark; major). In only one case was a shot fired by the police during the initial response, and in that case it was a single shot (Cambridge; serious).

72. Englewood, Grand Rapids, Jersey City, Milwaukee, New Brunswick, New Haven, Newark, Paterson, Rockford and Tucson (two major, three serious and five minor).

In at least five of these cases, arrests were made (Englewood, Jersey City, New Brunswick, Paterson, and Tucson; one serious and four minor).

73. Atlanta, Bridgeton, Cincinnati, Detroit, Elizabeth, Houston, Phoenix and Tampa (three major, three serious and two minor).

74. Detroit, Houston, Phoenix and Tampa; two major and two serious.

75. Cambridge, both Dayton disturbances, Jackson, Nashville and Plainfield (one major, four serious and one minor).

76. See annexed charts of levels of violence. In at least 13 instances the initial control response appeared to fail, in this sense. The three control approaches, dispersal, reconnaissance containment were almost equally represented in this group: six of these were cases of dispersal (Englewood, Grand Rapids Milwaukee, New Haven, Newark and Tucson; two major; two serious and two minor); four cases of containment (Cambridge, both Dayton disorders and Jackson; three serious and one minor); and three were cases of reconnaissance (Detroit, Houston and Tampa: two major and one serious).

77. If violence continued, or resumed after a pause, the second control response by local police (and, in the instances we have noted, by the outside forces which by then had arrived) again was one of the three categories of dispersal, reconnaissance and containment. However, at this stage, dispersal was used in a slightly larger number of cases than at the stage of the initial response: twelve cases, two more than in the initial response (Atlanta, Bridgeton Cambridge, Cincinnati, Detroit, Englewood, Milwaukee, Newark, New Brunswick, New Haven, Paterson and Rockford: four major, four serious and four minor). Containment was also now used in a slightly larger number of cases than at the earlier stage: nine cases, one more than before (both Dayton disturbances, Grand Rapids, Jackson, Nashville, Phoenix, Plainfield, Tampa and Tucson: two major, five serious and two minor). Reconnaissance, the most passive tactic and therefore understandably less tenable in the face of continued violence, was abandoned by half the forces which had used it initially but surprisingly was still employed by half: three forces (Cincinnati and Detroit, which turned to dispersal, and Tampa, which turned to containment; three major) abandoned reconnaissance for one of the other tactics, but reconnaissance was still used by three (Cambridge, Elizabeth, and Houston; two serious end one minor).

78. See footnote 22 to the section on "Levels of Violence and Damage" in Part I of this chapter. See also the Profiles on Newark and Detroit in Chapter 1.

79. This combination occurred in at least seven cases, two during the initial response (Englewood and Plainfield; one major and one minor) and five during a subsequent response (Cincinnati, Grand Rapids, Milwaukee, Nashville and New Haven; two major and three serious).

80. Atlanta, Detroit, Englewood, Grand Rapids, Jackson, Milwaukee, Newark, New Brunswick, New Haven, Phoenix and Plainfield (four major, five serious and two minor).

81. Cambridge, Nashville, Newark and New Haven (one major and three serious).

82. One major and one serious.

83. Cincinnati, Detroit, Jackson, New Haven, Newark, Plainfield, Phoenix, Rockford and Tampa (five major, three minor and one serious). In four of these nine disturbances (Detroit, Jackson, and, arguably, Phoenix and Rockford; one major, two serious and one minor) the entry of extra forces occurred after the first outbreak of violence. In four cities (Cincinnati, Newark, Plainfield, and Tampa; all major) extra forces were brought in after two outbreaks of violence. In one city (New Haven; serious) extra forces were brought in after three outbreaks of violence. See the annexed charts of levels of violence, and type and duration of law enforcement mobilization.

84. In all but two of these cities (Plainfield and, arguably, Rockford; one major and one minor) violence recurred thereafter on two occasions. In three cases, (Cincinnati, Tampa and Phoenix; two major and one serious) the subsequent violence was at lower levels than before the extra forces' arrival But in the majority of cases (Detroit, Jackson, New Haven, Newark, Plainfield and Rockford; three major, two serious and one minor) the intensity of violence recurring after the arrival of extra forces was equal to or greater than that of the earlier violence.

85. Bridgeton, Cambridge, Englewood and New Brunswick (one serious and three minor).

86. In one city (Englewood; minor) four outbreaks followed; in four cities (Bridgeton, Cambridge, Grand Rapids, and Jersey City; two serious and two minor) two outbreaks followed; and in one city (New Brunswick; minor) a single outbreak followed.

87. In three of the six cities (Bridgeton, Englewood and Grand Rapids; one serious and two minor) the level of violence in one or more successive outbreaks was the same as or higher than that in the first outbreak of disorder. In three of these cities (Cambridge, Jersey City and New Brunswick; one serious and two minor) the later outbreak or outbreaks was of lower intensity than the first or there was no further outbreak of violence.

88. Atlanta, both Dayton disorders, Elizabeth, Houston, Nashville, Paterson and Tucson; five serious and three minor.

89. Two of these cities (Paterson and Tucson; one serious and one minor), had four outbreak.; one (Atlanta; serious) had three outbreaks; two (Elizabeth and Nashville; one serious and one minor), had two outbreaks; and three (both Dayton disorders and Houston; two serious and one minor), had one outbreak. Of the four cities which had multiple outbreak., three (Atlanta, Paterson and Tucson; two serious and one minor), had subsequent outbreaks of violence at the same or a higher level of violence than the first outbreak.

90. There is evidence of a total of at least 68 such meetings in 21 of the 24 disturbances studied: only in three disorders (Cambridge, Milwaukee and Rockford; one major, one serious and one minor) is there no evidence of such meetings. The annexed charts include, on a horizontal line near the top, a depiction of such meetings through the period of disorder in the 21 cases.

91. In 17 of the 21 disturbances (excepting only Atlanta, Jackson, Jersey City and Paterson; three serious and one minor) the first meetings occurred either immediately before the disorder erupted or during the first or second day of disorders.

In only three of the 17 cases (Cincinnati, the Dayton September disturbance and New Brunswick; one major and two minor) did such meetings occur before the outbreak of violence.

92. Of the 16 disorders which had a duration of more than two days, the meetings also continued beyond that point in nine cases (Cincinnati the Dayton June disturbance, Detroit, Englewood, Grand Rapids, New Haven, Newark, Plainfield and Tampa; five major, three serious and one minor). In five of these nine cases (the Dayton June disturbance, Detroit, Englewood, Grand Rapids and Tampa; two major, two serious and one minor), the meetings also continued through the final two days of the disorders.

93. Of the 21 disturbances in which such meetings occurred established Negro leaders participated in meetings in 18 (all except Englewood, Jackson, and Phoenix; two serious and one minor).

94. Eight out of 21. In three cases (Englewood, Jackson and Phoenix; two serious and one minor), youths were the sole Negro participants in meetings with government officials.

96. Cincinnati, Nashville, New Brunswick, Plainfield and Tampa (three major, one serious and one minor). Of these five cases, the two elements of the Negro Community attended meetings together in two disorders (Cincinnati and Plainfield; one major, one serious) and in the remaining three disorders they attended such meeting separately.

96. This was the case in five disorders (Atlanta, Cincinnati, Houston, Plainfield and Phoenix; two major and three serious). In one of the five disorders (Phoenix; serious) the only meeting which established Negro leadership participated was one with Negro youths. In the remaining four cases, established Negro leadership also met with government officials. In three of the five disorders, Negro youths also met with government officials (all except Atlanta and Houston; both serious).

97. This occurred in nine of the 21 disturbances in which such meetings took place (Atlanta, Bridgeton, Cincinnati, the Dayton June disturbance, Elizabeth, Grand Rapids, Newark, New Brunswick and New Haven; one major, five serious and three minor). Also involved were representatives of local human relations commissions (Bridgeton, Cincinnati, both Dayton disturbances, Elizabeth, Nashville, New Haven, Newark, Plainfield, Tampa and Tucson; four major, three serious and four minor); state community relations agencies (Jersey City, Newark, Plainfield and Tampa; three major and one minor) and federal agencies. In four cities (Cincinnati, Detroit, Jersey City and Newark; three major and one minor) officials of the Community Relations Service of the U.S. Department of Justice were participants in meetings.

98. Meetings during 19 of the 21 disorders followed this pattern (all accept Houston and Tucson; one serious and one minor). In 13 cases the grievance related to the handling of the precipitating incident by the Police (Bridgeton, Cincinnati, Elizabeth, Grand Rapids, Jackson, Jersey City, Nashville, Newark, New Brunswick, New Haven, Paterson, Plainfield and Phoenix; three major, six serious and four minor).

99. Meetings during 12 of the 21 disorders followed this pattern (all except Atlanta Bridgeton, the Dayton September disturbance, Detroit, Eliza Nashville, Newark, New Haven and Paterson; two major, four serious three minor).

In seven cases the pre-existing grievances related to unemployment and underemployment (Cincinnati, the Dayton June disturbance, Englewood, Jersey City, New Brunswick, Phoenix and Tucson; one major, two serious and four minor). In six cases they related to inadequate recreation facilities (the Dayton June disturbance, Jersey City, New Brunswick, Plainfield, Tampa and Tucson; two major, one serious and three minor).

100. This was the case in 10 of the 21 disorders in which meetings were held. In most of these cases (8 of 10), the earlier meetings or early stages of meetings focussed on disorder-related grievances and the later meetings, or stages of meetings, focussed on pre-existing grievances (Cincinnati, Englewood, Grand Rapids, Houston, Jackson, Jersey City, Phoenix and Tampa; two major, four serious and two minor). In only two cases (New Brunswick and Plainfield; one major and one minor), was the order of subjects reversed.

101. The only disorders in which counter-rioters were not active were Bridgeton, Cambridge, the Dayton September disorder, Englewood, Milwaukee and Rockford (one major, one serious and four minor).

102. For a discussion of this study and the characteristics of those who so identified themselves, as compared with rioters, see Part III, THE RIOT PARTICIPANT infra.

103. Cincinnati, the Dayton June disorder, Detroit, Elizabeth, Grand Rapids, Houston, Nashville, Newark, New Brunswick, New Haven, Paterson, Plainfield, Phoenix, Tampa and Tucson (five major, seven serious and three minor).

104. For example, in Cincinnati the police opposed official recognition of counterrioters, whereas in Detroit and Dayton there was close cooperation between police and counter-rioters.

105. Nine of 15 (Cincinnati, the Dayton June disorder, Detroit, Elizabeth, Grand Rapids, New Brunswick, Newark, Phoenix and Tampa; four major, three serious and two minor).

106. Houston, Nashville, New Haven, Paterson, Plainfield and Tucson (one major, four serious and one minor).

107. In Elizabeth and Newark the counter-rioters wore arm bands (one major and one minor).

108. Atlanta, Cincinnati, Detroit, Jackson, Jersey City and Newark (three major, three serious and one minor).

109. Examples are: employees of city agencies (Detroit and Cincinnati; two major); ministers (Atlanta, Phoenix and Tampa; one major and two serious); college students (Grand Rapids, Newark, Jackson and Nashville; one major and three serious; civil rights leaders (Atlanta and Cincinnati; one major and one serious; young Negro militants (Phoenix, Jersey City and New Haven; two serious and one minor); poverty workers (Atlanta, Phoenix and Cincinnati; one major and two serious) and admitted former riot participants (Tampa; major).

110. Newark (major). In Paterson (serious) they held a block dance: in Phoenix (serious), they promised to make attempts to find jobs for rioters; in Jackson (serious) they kept nonstudents out of college dormitories; and in Atlanta (serious), they attempted to organize a Youth Corps Patrol, similar to Dayton's "White Hats." Counter-rioters used physical force to restrain rioters in two cities (Tampa and Nashville; one major and one serious). In neither case was the use of force officially authorized.

111. All four sources are subject to limitations, and we have therefore used each as a reliability check on the others. Eyewitness accounts are subject to retrospective distortion. Data on arrestees also involve built-in biases. The fact of arrest alone, without subsequent trial and conviction does not constitute evidence or the crime charged, and there has not been sufficient time for many of the 1967 riot arrestees to be brought to trial. Many of the most active rioters may have escaped arrest, while many of the uninvolved, or even counter-rioters, may have been arrested in the confusion. Finally, questions about riot activity in interview surveys may elicit overstatements of participation by some interviewees and under-statements by others.

We are conducting a continuing study of arrest records in a number of cities which experienced disorders in 1967 and in some earlier years as well. So far we have studied the records of 13,788 persons arrested during disturbances in 22 cities in 1967. The unpublished study of arrestees in Detroit, which was sponsored by the Department of Labor, Manpower Administration, involved interviews with 496 arrestees.

The Detroit and Newark surveys furnish the moat comprehensive information on mass participation.

The Detroit survey data represent a reanalysis by Dr. Nathan S. Caplan and Jeffery M. Paige, Institute for Social Research, University of Michigan, of data collected during the two weeks following the disorder, in a study sponsored by the Detroit Urban League. The Newark study was conducted for the Commission by Dr. Caplan and Mr. Paige, approximately six months after the disorder.

The Detroit analysis is baaed on 393 interviews with Negroes aged 15 and over. The Newark data are based on 233 interviews with Negro males between the ages of 15 and 35. In both surveys, the sampling area was determined by identifying the 1960 census tracts in which violence and damage occurred. Newspaper accounts were used to identify the location of riot damage, fires and looting. In Detroit, the sample was drawn from two riot areas, the West Side and the East side, including the following census tracts: nine through 22, 26-28, 36-43, 115-123 and 152-188 (West Side); 759-778 and 789-793 (East Side). The Newark sample was drawn from an inner-city area consisting of census tracts 12, 29-33, 38-40, 58-67 and 81-82.

A probability sample was drawn for both cities so that the probability of inclusion for any household in Detroit was approximately 1/5Oth and Newark 1/44th. Blocks were selected at random from within the specified census tracts and constituted the primary sampling unit for each study. In Detroit, lists of all dwellings in the selected blocks were prepared from a city directory. Every fifteenth address was identified and assigned to an interviewer. In Newark, segments of approximately 10 dwelling units were constructed by field enumeration of blocks selected at random and assigned to interviewers. Both studies used techniques described by Leslie Kish in Survey Sampling, New York, Wiley, 1965, Chapter 9.

Each interviewer in Detroit was instructed to conduct interviews only at those dwelling unite on his assignment sheet. Within households only Negroes were to be interviewed, and the interviewer was instructed to list all members of the household and then select every other one for interviewing. The interviewer was required to return twice if there was no answer to the initial call or if the respondent to be interviewed was not at home. This procedure yielded 437 interviews for 50 blocks, or 8.7 interviews per block.

In order to enlarge the sample of those who were likely to identify themselves as rioters, interviewers in Newark were told to interview only Negro males between the ages 15 and 35. They were instructed to interview all eligible respondents in each household. They were also required to return three times if there was no answer or if an eligible respondent was not at home. A total of 233 interviews were completed in 24 blocks, or 9.7 interviews per block.

In Detroit, 67.0 percent of all eligible respondents were interviewed; in Newark, 66.0 percent. While these response rates do not compare favorably with the usual 80-85 percent response rate in white, middle-class samples, they are comparable to the rates in other ghetto area studies. A Negro response rate of 71.0 percent was reported in another study in approximately the same area of Newark. See Chernik, J., Indik, B., and Sternlieb, G., "Newark-New Jersey: Population and Labor Force," Spring 1967, Institute of Management and Labor Relations, Rutgers -- The State University, New Brunswick, New Jersey.

In both surveys, questions were designed to permit comparisons of the characteristics and attitudes of those who (a) admitted active participation in rioting, referred to as "self-reported rioters:" (b) those who said they had sought to stop the rioting, the "counter-rioters:" and (c) those who claimed not to have been involved, the "noninvolved." These classifications were based on the answers to two questions, one direct and one indirect. The indirect question asked how active the respondent had been during the riot, without specifying in particular what he bad been doing. The second question, which appeared later in the questionnaire, asked whether the respondent had participated in various activities, such as trying to stop the riot, calling the fire department, or picking up goods and taking them home. Respondents were classified as "rioters" if they answered either that they were "active" or admitted one or more specific anti-social activities. They were classified as "counter-rioters" if they said that they were engaged in some pro-social activity whether or not they said they were "active." If they said that they had stayed home and also claimed not to have been "active," they were classified as "noninvolved." In the Detroit survey the analysis is based only on the answers of those 393 respondents who were willing to answer at least one of these classificatory questions. In the Newark survey the entire sample of 233 was used, and those who refused to answer either of the classificatory questions were included in the "noninvolved."

112. In Detroit, 11.2 percent (44) of the 393 respondents identified themselves as rioters, 15.8 percent (62) as counter-rioters, and the majority, 73 percent (287), as noninvolved. Bystanders included approximately 5 percent who admitted to having gone into the riot area but claimed not to have participated; and another 15 to 20 percent who claimed to have watched from the front steps or sidewalk in front of their homes. For purposes of analysis all of the 393 respondents other than the self-reported rioters and counterrioters were treated as the "noninvolved." In the Newark survey, where the sample was restricted to Negro males between the ages of 15 and 35, 45.4 percent identified themselves as rioters, and 54.6 percent as noninvolved. About 5 percent of the respondents identified themselves as counter-rioters, but were included as noninvolved because the number of persons was so small. The proportion of respondents who admitted active participation does not necessarily indicate the levels of support for rioting among inner-city Negroes. In Detroit, 23.3 percent of those interviewed felt that more was to be gained than lost through rioting. In Newark 47.0 percent agreed that more was to be gained and 77.1 percent said that they were generally sympathetic to the rioters.

113. In the more detailed discussion which follows, only those characteristics of the counter-rioter which differed from those of the noninvolved are highlighted.

114. Of 13,012 arrestees in 22 cities (Atlanta, Bridgeton, Cincinnati, Dayton, Detroit. Elizabeth Englewood, Grand Rapids, Houston, Jackson, Jersey City, Milwaukee, Nashville, New Brunswick, New Haven, Newark, Paterson, Phoenix:, Plainfield, Rockford, Tampa and Tucson; six major, nine serious and seven minor) 10,792 (82.9 percent) were Negroes, 1967 (15.1 percent) were whites, 78 (.6 percent) were Puerto Ricans and 37 (.3 percent) were of other races. The ethnic origin of 138 arrestees (1.1 percent) was unknown.

A study of 348 arrestees in Grand Rapids (serious) divided the disorder in that city into two time segments of 4 hours and 36 hours. During the first 4 hours of the disorder, 95 percent were Negroes. The proportion of Negro arrestees declined to 66 percent during the remaining 48 hours of the disorder. See "Anatomy of a Riot," United Community Services, Research Department, Grand Rapids and Kent County, Michigan, 1967.

115. Age Distribution

Image

The Grand Rapids data indicate that during the first 4 hours of the disorder 82 percent of the arrestees were under 25 years of age. During the remaining 48 hours, the proportion of arrestees under 25 years of ace declined to 58 percent. See "Anatomy of a Riot," op cit.

*Atlanta, Bridgeton, Cincinnati, Dayton, Detroit, Elizabeth, Jackson, Jersey City, New Brunswick, New Haven, Newark, Paterson, Plainfield, Rockford, Tampa and Tucson (five major five serious and six minor)

** R -Rioters

NI -Noninvolved

A -Arrestees

*** The symbol "p" represents the probability that a difference this great is a product of chance. The symbol ">" means greater than. The symbol "<" means less than.

116. Sex Distribution

Image
 
The Grand Rapids data indicate that during the first 4 hours of the disorders, 45 of the 46 persons arrested (98 percent) were males. During the remaining 48 hours of the disorder female arrestees increased, comprising 10 percent of a total of 274 adults.

* Atlanta Bridgeton, Cincinnati, Dayton, Detroit, Elizabeth, Englewood, Grand Rapids, Houston, Jackson, Jersey City, Nashville, New Brunswick, New Haven, Newark, Paterson, Phoenix, Plainfield, Rockford, Tampa and Tucson (five major, nine serious, and seven minor)

117. Marital Status

Image

118. Family Structure in Newark Survey

Image

119. Region of Upbringing

Image

120. Of 266 arrestees in five cities (Atlanta, New Brunswick, Plainfield, Tampa and Tucson; two major, one serious and two minor), 106 (40 percent) were born in the state in which the disorder occurred, 98 (37 percent) were born in the South (but not in the state in which the disorder occurred in the cases of Atlanta and Tampa; one major and one serious) and 23 (8 percent) went born elsewhere. The state of birth of 39 persons (15 percent) was undetermined. For purposes of the sample, the South was defined as Alabama, Arkansas, Delaware, Florida, Georgia, Kentucky, Louisiana, Maryland, Mississippi, North Caroline, Oklahoma, South Carolina, Tennessee, Texas, Virginia, Washington, D.C., and West Virginia.

121. The discrepancy between the percentages of the non-involved brought up in the North in Newark and Detroit (two major) is not significant since the Detroit sample includes more older people than the Newark sample. This di1ference does not affect the validity of the figures for youthful rioters.

122. Place of Birth

Image

123. Of 3,395 arrestees in 15 cities (Atlanta Bridgeton Dayton, Elizabeth, Grand Rapids, Jackson, Jersey City, New Brunswick, New Haven, Newark, Paterson, Plainfield, Rockford, Tampa and Tucson: three major, seven serious and five minor) 3,054 (90 percent) resided in the city in which the disorder occurred, 228 (7 percent) resided in the state in which the disorder occurred, and 48 (1 percent) resided elsewhere. The residence of 65 persons (2 percent) was undetermined.

124. Income Level

Image

125. See the section on "The Pattern of Disadvantage" in Part IV of this chapter.

126. Educational Level

Image

127. Employment Status

Image

128. Underemployment in Newark Survey

Image

129. Occupation Level in Newark Survey

Image

130. Job Aspiration in Newark Survey

Image

131. Perceived Job Opportunity in Newark Survey

Image

132. Perceived Obstacles to Employment in Newark Survey

Image

133. Ability and Success in Detroit Survey

Image

134. Racial Consciousness

Image

135. Black Conscious in Newark Survey

Image

136. Anti-White Attitudes

Image

137. Hostility Toward Middle-Class Negroes in Newark Survey

Image

138. Half the arrestees were charged with one or more of three offenses: breaking and entering, trespassing, or curfew violation.

Of 13,112 offenses charged against 12,457 persons in 19 cities (Atlanta, Bridgeton, Cincinnati, Dayton, Detroit, Elizabeth, Englewood, Grand Rapids, Jackson, Jersey City, Milwaukee, New Brunswick, Newark, Paterson, Phoenix, Plainfield, Rockford, Tampa, and Tucson; six major, six major, six serious and seven minor), 4,108 (31 percent) were charges of breaking and entering or trespassing and 2,506 (19 percent) were charges of curfew violation. The breakdown of charges by categories was:

Image

139. Political Information in Newark Survey

Image

140. Political Involvement in Newark Survey

Image

141. Trust of the Government in Newark Survey

Image

142. Political Grievances in Detroit Survey

Image

143. Perception of Country as Not Worth Fighting For

Image

FOOTNOTES TO CHAPTER 2 IV

The Pattern of Disadvantage


144. For purposes of this section the three university-related riots, in Houston, Jackson and Nashville, have not been included.

145. See the discussion of Grievances in relation to the riot process in Part II of this chapter.

146. Our discussion relies heavily upon 1960 census data, which are always the most complete and usually the most recent data available. Nevertheless, 1960 statistics are outdated for describing American urban life in 1967 and consequently, we used more recent data wherever possible.

We have examined, for most purposes in this section, 20 of the 23 surveyed riot cities. Three cities (Houston, Jackson and Nashville; three serious) were excluded because their disturbances were more directly campus- related than city-related.

In each of 17 cities, we have compared conditions in the riot area with conditions elsewhere in (1) the city as a whole, and (2) the metropolitan area of which the city is a part, including the suburban areas. In addition, we have sought to determine whether racial differences affect these comparisons. To do this, we have identified census tracts in which violence and damage occurred. This is limited to 17 cities because identification of the disturbance area for purposes of analysis was not possible for three cities (Bridgeton, Cambridge and New Brunswick; one serious and two minor). 1'bey are not divided into census tracts.

We recognize that participants in the disorders did not necessarily live in the area of disorder. However, we have attempted to learn whether the disturbance areas have characteristics which set them apart from the cities and metropolitan areas in which the disturbance areas are situated.

The disturbance areas were primarily commercial areas in a part of the city having a high concentration of Negro residents. These were usually characterized by a number of retail or wholesale shops, often with residences above the shops and with residential areas immediately adjacent to the commercial streets. In two cities (Atlanta and Tucson; one serious and one minor) the disturbance area was primarily residential.

147. After studying 20 cities, The Department of Labor reached the same conclusion: "Negroes living in non-poverty areas were not much better off than those in poverty areas; among whites, the differences were very sharp." (U.S. Department of Labor, Bureau of Labor Statistics, Special Labor Force Report No. 75, "Poverty Areas of Our Major Cities," October, 1966, p. 1105.)

148. The Bureau of the Census categorizes citizens as white and nonwhite. Since 92 percent of the nonwhites in the United States are Negroes we have used the terms "Negro" and "nonwhites" interchangeably throughout this section. The numbers compared in the section are medians for the 17 cities.

149. In eight cities, white population also increased in that period, however, it did so at a much lower rate. Only Englewood (minor) showed no change in white population during that period.

150. In 13 of 17 cities (Atlanta, Cincinnati, Dayton, Detroit, Grand Rapids, Jersey City, Milwaukee, Newark, Paterson, Phoenix, Tucson, Rockford and Tampa; five major, five serious and three minor), including seven of the cities which experienced the most severe violence, the percentage of Negro population in the disturbance area was more than twice the percentage of Negro population in the entire city; in nine of the cities, the percentage of Negro population in the disturbance area was more than triple the citywide percentage.

151. Comparing Negroes and whites in the cities: The percentage of Negro population 24 years of age or younger in all 17 cities exceeded the percentage of whites in that age group. The percentage of Negro population 65 years of age or older in all 17 cities except two (Phoenix and Tucson; one serious and one minor) was less than one-half the percentage of whites in that age group.

Comparing Negroes in the disturbance areas and Negroes in the cities: The percentage of Negro population 24 years of age or younger living in the disturbance area in approximately half the cities (Cincinnati, Elizabeth, Englewood, Grand Rapids, Newark, Phoenix, Plainfield and Tucson; three major, two serious and three minor) exceeded the city-wide percentage. The percentages were equal only in Tampa (major).

The differences we have seen are even greater when the age distribution among Negroes in the disturbance areas 18 compared with the age distribution among whites in the Standard Metropolitan Statistical Areas (SMSA's).

Median Age Distribution (%)

Image

152. Comparing Negroes and whites in the cities: The number of median years of school completed by Negroes was less than the median number for whites in all 17 cities. In 13 of 17 cities (Atlanta, Cincinnati, Dayton, Detroit, Elizabeth, Englewood, Grand Rapids, Milwaukee, Phoenix, Plainfield, Rockford, Tampa and Tucson; four major, five serious and four minor) there was a difference of at least one year.

The percentage of Negro population over 25 years of age having eight years or less of education in all 17 cities was greater than the percentage of white population.

Comparing Negroes in the disturbance areas and Negroes in the cities: The median years of school completed by Negroes in the disturbance area in more than half of the 17 cities (Dayton, Elizabeth, Englewood, Grand Rapids, Newark, Phoenix, Plainfield, Rockford and Tucson; two major, three serious and four minor) was lower than the median rate of education for Negroes in the entire city. In three of the 17 cities (Jersey City, Milwaukee and Tampa;. two major and one minor) the median years completed by Negroes in the disturbance area and by Negroes in the city were equal. In the remaining five cities the median rate was slightly higher (less than a year's difference) for Negroes in the disturbance area. The difference between the median number of years completed was one-tenth of a year for the 17 cities. The percentage of Negro population in the disturbance area over 25 years of age having eight years or lees education was slightly greater than the city-wide percentage in 11 of the 17 cities (Dayton, Elizabeth, Englewood Grand Rapids, Milwaukee, Newark, Phoenix, Plainfield, Rockford, Tampa and Tucson; four major, three serious and four minor). The differences we have seen are even greater when comparing the level of education of Negroes in the disturbance areas with that of whites in the SMSA's:

Median Education

Image

153. Comparing Negroes and whites in the cities: The percentage of Negro males in the labor force in nine of 17 cities (Elizabeth, Englewood, Jersey City, Milwaukee, New Haven, Newark, Paterson, Rockford and Tampa: three major, two serious and four minor) exceeded the percentage of white males. The proportion of Negro and white males employed or seeking employment was equal in Grand Rapids (serious).

The percentage of Negro females exceeded the percentage of white females in the labor force in all 17 cities.

Comparing Negroes in the disturbance area and Negroes in the cities: The percentage of Negro males in the disturbance area in the labor force. in all except seven cities (Dayton, Elizabeth, Englewood, Grand Rapids, Newark, Plainfield and Tucson: two major, two serious and three minor), exceeded the percentage of Negro males in the entire city in the labor force.

The percentage of Negro females in the labor force in the disturbance area, in all except ten cities (Atlanta, Dayton, Detroit, Elizabeth Englewood, Grand Rapids, Jersey City, Paterson, Phoenix and Plainfield; two major, five serious and three minor) was larger than the percentage of Negro females in the entire city in the labor force.

The differences in the percentages of Negroes and whites in the labor force again can be seen to be small by comparing Negroes in the disturbance area with whites in the SMSA:

Median Labor Force Participation Rates (%)

Image

More recent and complete data indicate that unemployment and under- employment of Negroes are even more serious than the 1960 census revealed. The Bureau of Labor Statistics reported ("Poverty Areas of Our Major Cities," op. cit.) in late 1966 that one out of every six Negro males was not reported in the 1960 census. B.L.S. surveyed ten slum areas of eight cities and obtained data for five other cities. Two of these cities, Detroit and Phoenix (one major and one serious) were among the cities we surveyed. The Bureau found, in the slum areas surveyed, that:

The unemployment rate was approximately three times the nationwide rate of 3.7 percent;

Six and nine-tenths percent of those listed as employed were working only part time although they were trying to find full-time work; the comparable figure for the nation as a whole was 2.3 percent;

Twenty-one percent of those working full time were earning less than $60 a week; the comparable figure for the nation as a whole was 15.4 percent;

In another study The Department of Labor found that 33.9 percent of the labor force were subemployed and 70 percent of the subemployed population was Negro. U.S.-Department of Labor, "A Sharper Look at Unemployment in U.S. Cities and Slums," p. 6.

The Bureau of Labor Statistics included in its definition of subemployment (i) those unemployed in the sense that they are actively looking for work and unable to find it; (ii) those working only part time when they are trying to get full-time work; (iii) those heads of households under 65 who earn less than $60 per week working full time and those individuals under 66 who are not heads of households and earn less than $56 per week in a fulltime job; (iv) half the number of "non-participants" (not in the labor force) in the male 20-64 age group; and (v) a conservative and carefully considered estimate of the male undercount group.

154. Comparing Negroes and whites in the cities: The percentage of Negro male unemployment in all 20 cities was higher than the unemployment rate for white males. In 13 of the 20 cities (Bridgeton, Cambridge, Cincinnati, Detroit, Englewood, Grand Rapids, Milwaukee, New Brunswick, New Haven, Paterson, Phoenix, Plainfield and Rockford; four major, five serious and four minor) the rate of unemployment for Negroes was more than twice the rate for whites.

The unemployment rate for Negro females more than the rate for white females in all of the 20 cities except Plainfield (major).

Comparing Negroes in the disturbance areas and Negroes in the cities: The unemployment rate for Negro males in the disturbance area was slightly more than the Negro citywide rate in 11 of 17cities and slightly less in the remaining six (Atlanta, Cincinnati, Detroit, Englewood, New Haven and Paterson; two major, three serious and one minor).

The disturbance area unemployment rate for Negro-females equalled or exceeded the citywide rate in seven of 17 cities (Cincinnati, Milwaukee, New Haven, Newark, Rockford, Tampa and Tucson; four major, two serious and one minor).

The differences are even greater when the unemployment rate among Negroes in the disturbance areas is compared with the unemployment rate among whites in the SMSA's:

Median Unemployment Rate (%)

Image
admin
Site Admin
 
Posts: 36230
Joined: Thu Aug 01, 2013 5:21 am

Re: Report of the National Advisory (Kerner Report 1967)

Postby admin » Mon May 02, 2016 9:20 am

Part 5 of 5

155. Labor Force Participation Increases as Better Job Opportunities Appear.

156. Comparing Negroes and whites in the cities: The percentage of Negro male unskilled and service workers in ten of 17 cities (Atlanta Cincinnati, Dayton, Englewood, Grand Rapids, Phoenix, Plainfield, Rockford, Tampa and Tucson; three major, four serious and three minor) was at least three times the rate of whites.

The percentage of Negro female unskilled and service workers in seven of 17 cities (Cincinnati, Detroit, Elizabeth, Grand Rapids, Milwaukee, New Haven and Rockford; two major, three serious and two minor) was at least twice the percentage of whites.

Comparing Negroes in the disturbance areas and Negroes in the cities: The percentage of Negro male unskilled and service workers in the disturbance areas in 11 of the 17 cities (Dayton, Englewood, Grand Rapids, Jersey City, Newark, Paterson, Phoenix, Tucson, Plainfield, Rockford and Tampa; three major, four serious and four minor) slightly exceeded the percentage in the cities as a whole. The difference between the median of percentages in the disturbance areas and the median of percentages in the cities was 4.5 percent.

The percentage of Negro female unskilled and service workers in the disturbance areas in eight of the 17 cities (Atlanta, Cincinnati, Detroit, New Haven, Plainfield, Rockford, Tampa and Tucson; four major, two serious and two minor) was slightly smaller than the percentage of Negro female unskilled and service workers in the cities. The difference in 17 city medians was 3.6 percent.

The differences are even greater when comparing the percentage of Negro unskilled and service workers in the disturbance areas with whites in the SMSA's:

Unskilled and Service Workers Median (%)

Image

157. Comparing Negroes and whites in the cities in 1960: The median income of Negroes in 17 cities was 69.5 percent of the median income of whites. The 1966 nationwide median income earned by Negroes was 58 percent of the median income earned by whites. ("Social and Economic Conditions of Negroes in the United States," Joint Report by the Bureau of Labor Statistics and the Bureau of the Census, October, 1967, p. 15, Bureau of Labor Statistics Report No. 332.)

The percentage of Negroes and whites in poverty (having an annual income under $3,000) in 14 of the 17 cities was twice the percentage of whites in poverty. In the other three cities (Englewood, Newark and Paterson; one major, one serious and one minor) the percentage was at least one and one-half the percentage of whites.

Comparing Negroes in the disturbance areas and Negroes in the cities: The percentage of the families below the poverty line was slightly higher in the disturbance areas in almost two-thirds or 17 cities (Dayton, Elizabeth, Englewood Grand Rapids, Milwaukee, New Haven, Newark, Phoenix, Plainfield, Tampa and Tucson; four major, four serious and three minor). The differences are even greater when the income levels of Negroes in the disturbance areas are compared with the income levels of whites in the SMSA's:

Median Income

Image

158. Comparing Negroes and whites in the cities: The percentage of Negro children under 18 living with both parents in all 17 cities was lees than the percentage of white children that age similarly situated.

Comparing Negroes in the disturbance areas and Negroes in the cities: The percentage of Negro children under 18 living with both parents in the disturbance area was greater than the city-wide percentage in seven of the 17 cities (Atlanta, Dayton, Milwaukee, New Haven, Newark, Rockford and Tucson: two major, three serious and two minor).

The differences are even greater when comparing the family status of Negroes in the disturbance areas and of whites in the SMSA's:

Family Status

Image

159. Family Stability Improves as Family Income Rises

Image

160. Comparing Negroes and whites in the cities: The percentage of Negro owner-occupied units in all 17 cities was lower than that of whites. In ten of the cities (Atlanta, Cincinnati, Detroit, Elizabeth, Jersey City, Milwaukee, New Haven, Newark, Paterson and Tampa; five major, three serious and two minor) the proportion of white home ownership was at least one and one-half that of Negroes. In five of the ten cities (Cincinnati, Milwaukee, New Haven, Newark and Paterson; three major and two serious) the percentage of white home ownership was twice that of Negroes.

Although Negroes paid the same or slightly lower rents than did whites among non-home owners in 15 of the 17 cities (all except New Haven and Paterson: two serious), they paid a higher proportion of income for rent than whites. Median rent as a proportion of median income in 11 of 13 cities (Atlanta, Cincinnati, Dayton, Detroit, Grand Rapids, Jersey City, Milwaukee, Newark, Paterson, Plainfield and Tampa; six major, four serious and one minor) was higher for Negroes than for whites. Negroes paid the same proportion as whites in Phoenix (serious) and a smaller proportion than whites in Englewood (minor).

The percentage of overcrowded Negro-occupied homes (homes with more than 1.01 persons per room) in all of the 17 cities except Tucson (minor) was twice the percentage of overcrowded white-occupied homes. In nine of those cities (Elizabeth, Englewood, Grand Rapids, Milwaukee, New Haven, Paterson, Plainfield, Rockford and Tampa; three major, three serious and three minor) the percentage of overcrowded Negro-occupied homes was three times the percentage of white homes.

The percentage of homes occupied by whites which were sound and had adequate plumbing facilities was one and one-half times the proportion of Negro-occupied homes which met those criteria, in ten of 17 cities (Atlanta, Cincinnati, Elizabeth, Jersey City, Milwaukee, New Haven, Newark, Paterson, Phoenix and Tucson; three major, four serious and three minor). Comparing Negro housing in the disturbance area and in the entire city: The percentage of Negro owner-occupied units in the disturbance area exceeded the Negro city-wide percentage in six of 17 cities (Atlanta, Cincinnati, Jersey City, New Haven, Paterson and Tucson; one major, three serious and two minor). The city-wide median for 17 cities was 3.8 percentage points higher than the median for the disturbance area.

Negroes in the disturbance area paid more for rent than Negroes paid citywide in eight of 13 cities (Atlanta, Cincinnati, Dayton, Detroit, Grand Rapids, Jersey City, Paterson and Plainfield; three major, four serious and one minor). In Milwaukee (major) they paid the same. In four cities they paid less (Englewood, Newark, Phoenix and Tampa; two major, one serious and one minor).

The proportion of income paid for rent by Negroes living in the disturbance area slightly exceeded the city-wide proportion paid by Negroes in eight of 13 cities (Cincinnati, Dayton, Englewood, Grand Rapids, Milwaukee, Newark, Plainfield and Tampa; four major, one serious and three minor). The proportions were equal in Detroit (major). The difference in medians was three-tenths of one percent.

The percentage of overcrowded homes in which Negroes lived in the disturbance area was slightly greater than the percentage of overcrowded homes in which Negroes lived city-wide in eight of the 17 cities (Cincinnati, Elizabeth Englewood, Grand Rapids, Plainfield, Newark, Tampa and Tucson; four major, one serious and three minor). The median 17-city difference was 1.1 percentage points.

The percentage of sound homes in the entire city was slightly greater than in the disturbance area in ten of the cities (Dayton, Englewood, Grand Rapids, Milwaukee, New Haven, Newark, Plainfield, Rockford, Tampa and Tucson; four major, three serious and three minor). The difference in medians was .7 percentage point.

The differences are even greater when comparing the housing conditions of Negroes in the disturbance areas and of whites in the SMSA's:

Rent

Image

FOOTNOTES TO CHAPTER 2-IV

Local Governmental Structure


161. For purposes of this section we have not included the three university communities.

162. Source: The Municipal Year Book 1967, The International City Managers' Association (Chicago 1967).

163. Detroit, Elizabeth, Jersey City, Newark, New Haven, Paterson, Rockford and Tampa (three major, two serious and three minor). In the case of Paterson, virtually no powers were left to the aldermen.

164. Atlanta, Bridgeton, Cambridge, Englewood and Plainfield (one major, two serious and two minor).

185. In the five cities having a council-city manager system, the city manager was appointed by the council, and the mayor's powers were limited (Cincinnati, Dayton, Grand Rapids, Phoenix and Tucson; one major, three serious and one minor).

In the one city having a commission form of government (New Brunswick; minor), the major was selected by the commission from its own membership and traditionally was the commissioner who received the largest popular vote. The mayor shared executive power with the other commissioners.

166. In three they were elected by the legislative bodies from their own membership (Cincinnati, Dayton and New Brunswick; one major, one serious; and one minor).

167. Bridgeton, Cambridge, Dayton, Englewood, Grand Rapids, New Brunswick, Plainfield and Tucson (one major, three serious and four minor). The part-time mayors had a variety of other occupations: in Bridgeton, the mayor was a clothing store clerk; in Cambridge, a plumbing contractor; in Dayton, a real estate investor; in Englewood, a businessman who worked in New York; in Grand Rapids, a part-owner of a restaurant supply business; in New Brunswick, a housewife; in Plainfield, a lawyer; and in Tucson, a pharmacist.

168. In 15 of the 20 cities, the principal executive, either the mayor or the city manager, earned an annual salary ranging from $15,000 to $35,000 (Atlanta, Cincinnati, Dayton, Detroit, Elizabeth, Grand Rapids, Jersey City, Milwaukee, Newark, New Haven, Paterson, Phoenix, Rockford, Tampa and Tucson; five major, six serious and four minor). The other five cities studied had no city manager and a part-time mayor whose annual salary was less than $2,000 in four cases and $5,500 in one case (Bridgeton, Cambridge, Englewood, New Brunswick and Plainfield; one major, one serious and three minor). In all five cities having a council-city manager system, the appointed city manager's salary was significantly higher than the salary of the elected mayor (Cincinnati, Dayton, Grand Rapids, Phoenix and Tucson; one major, three serious and one minor).

169. Thirteen mayors bad terms of four years (Atlanta, Cambridge, Dayton, Detroit, Elizabeth, Grand Rapids, Jersey City, Milwaukee, Newark, New Brunswick, Rockford, Tampa and Tucson; four major, four serious and five minor). Two had terms of three years (Bridgeton and Paterson; one serious and one minor), and five had terms of two years (Cincinnati, Englewood, New Haven, Phoenix and Plainfield; two major, two serious and one minor). There appeared to be no pattern as to the length of time a mayor had been in office prior to the disturbance.

In four of the 20 cities the mayor bad been in office for less than two years (Grand Rapids, New Brunswick, Paterson and Tampa; one major, two serious and one minor). In three cities the mayor had been in office for seven years or more (Milwaukee, New Haven and Rockford; one major, one serious and one minor). In the remaining cities, the mayor's tenure had ranged from two to seven years.

In two cities (Paterson and New Brunswick; one serious and one minor), the mayors had been in office for six months and two months respectively. In both cases the mayor appealed to people in the disturbance area to give the new administration a chance to solve the city's problems, and these appeals appeared to have had an effect in dampening the disorders.

170. Atlanta, Bridgeton, Cincinnati, Dayton, Detroit. New Brunswick, Phoenix and Tampa (three major, three serious and two minor).

171. Cambridge, Grand Rapids, Milwaukee, New Haven, Paterson, Rockford and Tucson (one major, four serious and two minor).

172. Elizabeth, Englewood, Jersey City, Newark and Plainfield (two major and three minor).

173. Of a total of 207 legislators in the 20 cities, 20 (or 10 percent) were Negroes.

174. Bridgeton, Elizabeth, Grand Rapids, Rockford, Tampa and Tucson (one major, one serious and four minor).

175. In Newark the budget director and the director of health and welfare were Negroes; in Cincinnati, the city solicitor was a Negro; in Jersey City, the director of health and welfare was a Negro; and in Detroit, an aide to the mayor was a Negro.

176. Atlanta, Cincinnati, Dayton, Detroit, Englewood, Newark and Phoenix (three major, three serious and one minor).

177. All except Milwaukee, Tampa and Tucson (two major and one minor). Of the 205 board of education members in those cities. 24 (or 11 percent) were Negro.

178. Excepting Englewood, New Brunswick and Paterson (one serious and two minor). In some instances it was called a "community relations commission" or "human rights commission."

179. Only the Equal Opportunities Commission in New Haven (serious) had the power to subpoena witnesses and enforce compliance with its decisions.

180. Thirteen councils had full-time, paid staff of two or more responsible to the council itself (Atlanta, Cincinnati, Dayton, Detroit, Elizabeth, Grand Rapids, Milwaukee, Newark, New Haven, Phoenix, Plainfield, Tampa and Tucson; six major, five serious and two minor). In four cities, the councils had no paid staff (Bridgeton, Cambridge, Jersey City and Rockford; one serious and three minor).

Three of the four councils having no paid staff had been relatively inactive in the year prior to the 1967 summer disturbances. Cambridge (serious) held no meetings. and Jersey City (minor) had held one at which they decided their services were not needed during the summer. The council in Rockford (minor), which had not met for over a year, was in the process of being reorganized.

181. Of the 13 councils from which such information was available, five councils reported receiving more than 100 complaints annually (Atlanta, serious, 700 to 800; Detroit, major, 116; Elizabeth, minor, approximately 200; Newark, major, approximately 750; Plainfield, major, approximately 200). Three councils reported receiving 50 to 100 complaints (Cincinnati, major, approximately 50; New Haven, serious, approximately 60; Phoenix, serious, approximately 75). Five councils reported receiving less than 50 (Dayton, serious, 45; Grand Rapids, serious. approximately 25; Milwaukee, major, approximately 40; Tampa, major, 46; and Tucson, minor, 10).

The majority of the complaints from the 12 councils which reported this type of information were in the areas of housing discrimination building and housing code enforcement, and discrimination in employment and promotion practices.

182. Two years ago in Rockford the 18-member human relations commission was asked to investigate an alleged incident of police brutality but, after a preliminary meeting to discuss the matter, held no further meetings. In the late spring of 1967, the Commission was reorganized with a number of new members.

In Plainfield, city agencies opposed an attempt by the Human Relations Commission to conduct its own investigation of complaints of police brutality prior to the 1967 disorder.

183. Cincinnati, Detroit, Elizabeth, Englewood, Newark, New Haven, Paterson, Phoenix and Tucson (three major, three serious and three minor). Only those in Detroit, New Haven and Tucson had been in existence more than two years prior to the disorder.

Four police departments (Paterson, Detroit, Rockford and New Haven; one major, two serious and one minor) had specialized complaint bureaus within the department, and in two cities (Paterson and Detroit) these bureaus had investigative authority.

In Milwaukee there was a Police and Fire Commission consisting of five members. Until recently only property owners were authorized by law to file complaints with the Commission. The law has since been amended to permit any registered voter to file complaints, but few complaints have been filed.

184. Eight of the nine, Englewood (minor) excepted.

185. Detroit and Newark (both major).

186. We have not attempted to analyze the often substantial social and economic programs of other levels of government.

Of necessity we have also restricted ourselves to only the most general quantitative comparisons, within each of the three cities, of the size of the selected federal programs, the number of people in need of them, and the number of people in any way reached by them. We have not attempted the far more difficult task of evaluating the efficiency of the programs or the quality of assistance provided to recipients or its impact on their lives. Qualitative evaluation is the responsibility of many other agencies of the Federal government and beyond our own mandate. Our evaluation necessarily assumes that all those reached are reached effectively. If the factor of effectiveness were taken into account, the magnitude of the still unmet needs might be even greater than our estimates.

As in "The Pattern of Disadvantage," supra, we have used 1960 Census data as the basis for most of our observations as to need. We are keenly aware of difficulties involved in comparing 1967 programs with 1960 needs and have used more recent data wherever available. In most instances the needs were even greater in 1967 than in 1960.

Various federal programs account for their expenditures in different ways and for different periods of time. We have generally used figures for fiscal year 1967, ending June 30, 1967, or calendar year 1967, as available in each case. We are cognizant also of the difficulties involved in considering only expenditures for 1967 as a measure of Federal efforts to deal with ghetto problems. Much was done in earlier years by these programs and more is being done now. We have generally chosen a single year's funding only as a measure of the level of Federal effort during the most recent period. The choice of a recent year for measuring Federal expenditures created a further problem, however. The amount of funds authorized or obligated for a particular program is usually higher than the actual disbursements for that program in a given time period, but data on disbursements is usually available only some time after the period has ended. With the exception of housing and welfare, we have relied upon the higher obligation figures.

187. Institutional training programs administered through local school boards under the Manpower Development and Training Act (MDTA) have been included instead with education programs.

188. Two of the programs had no fixed number of trainee positions. The following table further describes these programs.

Detroit *

Image

Federal Funds Obligated

Image

189. Need -- In the spring of 1967 the labor force in Newark numbered 155,770 persons, of whom 90,358 were nonwhite. The unemployment rate during that period was 5.9 percent for whites, 11.5 percent for Negroes, and 13.4 percent for others (principally Spanish-speaking persons). A Rutgers University study in the spring of 1967 identified 3,859 unemployed whites, 8,932 unemployed Negroes, and 1,700 other unemployed nonwhites.

Programs -- During the first two quarters of 1967, 12 job training programs in Newark were supported by $2,681,853 of Federal funds. These programs provided for 2,840 trainees.

Newark* Federal Funds Obligated

Image

190. Need -- The Connecticut State Employment Service estimates there were approximately 145,000 to 150,000 nonagrarian workers in the labor force In New Haven and 12 surrounding towns during the first three quarters of 1967. The unemployment rate for the same period averaged approximately 3.5 percent.

Programs -- During the first three quarters of 1967 there were 14 manpower programs In New Haven in various stages of operation. These provided $2,150,828 of Federal funds for 1,574 trainees. The number of trainees was not available for one program.

New Haven * Federal Funds Obligated

Image

191. Need -- There are more than 295,000 students in the Detroit public schools, of whom 43 percent are white and 56 percent Negro. Nearly 60 percent (about 175,000) are educationally disadvantaged within the definition of Title I. Thirty percent of the white students and 84.5 percent of the Negro students are in this group. There are approximately 180,000 functionally illiterate adults in Detroit.

The Detroit school board recently stated that it may cost twice as much to educate a ghetto child as it costs to educate a suburban child and produce the same educational result. The Superintendent of Detroit schools has estimated that, to educate inner-city children, as much as $500 or $600 per pupil is needed in addition to the present average state and local expenditure of $565 per pupil.

Programs -- Detroit schools are scheduled to receive about $11 million during the 1967-68 school year under ESEA Title I. Of the estimated 175,000 low-income students, only about 55,000 are direct beneficiaries of Title I programs. Thus, while the $11 million represents $200 per student for the 55,000 direct recipients, 120,000 (or 69 percent) other educationally disadvantaged students are not participating in the programs.

The Adult Basic Education program is scheduled to receive $244,766 during the 1967-68 school year to serve about 3,900 adults.

Federal funding for public school students from kindergarten through high school for the 1967-68 school year will total $14,514,447. For a student population of 295,0001 these funds add an average of about $49 per student to the state and local expenditures of approximately $565 per student.

Detroit * Federal Funds Obligated For 1967-1968 School Year

Image

192. Need -- There are approximately 76,000 students in the Newark schools of whom 21 percent are whites and 79 percent are Negroes, Puerto Ricans and others. Approximately 33,000 (44 percent) of these students are from low-income families. In 1960 there were approximately 66,000 functionally illiterate adults in Newark.

Programs -- Newark schools are scheduled to receive about $4 million during the 1967-68 school year under ESEA Title I. Of the estimated 33,000 educationally disadvantaged students, only about 24,000 (or 72 percent) are direct beneficiaries of the Title I programs. Thus, while $166 per student is spent for programs for the direct recipients, 9,000 educationally disadvantaged students are not receiving the benefits of the programs.

The Adult Basic Education program is scheduled to receive $169,000 during the 1967-68 school year to serve approximately 3,000 students at a cost of about $56 per person.

Federal funding for public school students from kindergarten through high school in Newark during the 1967-68 school year will total $4,564,098. For a student population of 75,000, these funds add an average of approximately $60 per student to the state and local expenditures of about $565.

Newark * Federal Funds Obligated for 1967-1968 School Year

Image

193. Need -- There are more than 21,000 students in the New Haven public schools, of whom 47.9 percent are whites and 52.1 percent are Negroes, Puerto Ricans and others. In the middle and senior high schools an estimated 2,500 students are educationally disadvantaged. Of 33 elementary schools, 14 are designated as inner city or target schools for funds under ESEA Title I, and seven others reportedly could have been so designated. More than 50 percent of all elementary students (6,637 of 13,050) are in the 14 target schools. Twenty-two percent of the white students and more than 73 percent of the nonwhite students are in the target schools. There are an estimated 20,000 functionally illiterate adults in New Haven.

Programs -- New Haven schools are scheduled to receive nearly $1 million in the 1967-68 school year under ESEA Title I. Of the 2,500 low-income students in middle and senior high schools, approximately 1,000 are beneficiaries of the programs. Because of the comprehensive nature of the Title I programs in New Haven, all 6,637 students in the 14 target elementary schools are recipients of the programs although not all are educationally disadvantaged. The number of educationally disadvantaged students who do not receive benefits from the programs because they attend the 19 non-target elementary schools is unknown.

The Adult Basic Education program is scheduled to receive $23,000 during the 1967-68 school year to serve almost 700 persons.

Federal funding for public school students from kindergarten through high school for tile 1967-68 school year will total $1,090,260. For a student population of 21,000, these funds add an average of nearly $52 per student to the local and state expenditures of approximately $697 per student.

New Haven * Federal Funds Obligated For 1967-1968 School Year

Image

194. We have considered as substandard, in accordance with the definition of the Department of Housing and Urban Development, all units which were characterized by the census as dilapidated or as lacking one or more plumbing facilities. U. S. Bureau of Census, Measuring the Quality of Housing, An Appraisal of Census Statistics and Methods, Working Paper #25. Washington, D. C., 1967. We have treated as overcrowded all units identified by the census as having more than 1.01 persons per room, in accordance with the definition recently used by the Census Bureau and the Bureau of Labor Statistics. Social and Economic Conditions of Negroes in the United States, October, 1967, p. 57. Since many units are included in both categories, it is not possible to establish a total level of need by adding the numbers of units in the two categories, and we have therefore applied the two standards separately.

195. Need -- In 1960 there were 553,198 housing units in Detroit. Of these, 36,810 were substandard and 45,126 were overcrowded.

Programs -- Federal funds in the amount of $78,656,000 were expended through September, 1967 for housing completed under the first three programs examined. An additional $41,000 were expended through December, 1967 under the Rent Supplements program. BMIR mortgagee in the amount of $4,173,000 were insured by FHA through September, 1967. In the 1957-67 period, although no new public housing was constructed, 25 housing units were added as a result of FHA foreclosures. During this period, 346 units were constructed for the elderly and handicapped; families in 62 units were assisted through rent supplements; and mortgagee on 325 units were insured under the BMIR program.

Detroit * Cumulative Through September 30, 1967 Except for Rent Supplements, Which Are Described As Of December 31, 1967

Image

196. Need -- In 1960 there were 134,872 housing units in Newark. Of these, 23,743 were substandard and 16,600 were overcrowded.

Programs -- Federal funds in the amount of $101,177,000 were expended through September, 1967 for housing completed under the first three programs examined. An additional $22,000 were expended through December, 1967 under the Rent Supplements program. BMIR mortgages in the amount of $20,308,000 were insured by FHA through September, 1967. Newark has 10,766 public housing units, of which 20 percent (2,174) were constructed after 1959. Since 1959, 299 units have been constructed for the elderly and handicapped; families in 50 units have been assisted through rent supplements; and mortgages on 1,228 units have been insured under the BMIR program.

Newark * Cumulative Through September 30, 1967 Except for Rent Supplements, Which Are Described As of December 31, 1967

Image

197. Need In 1960 there were 51,471 housing units in New Haven. Of these, 6,667 are substandard and 4,278 were overcrowded.

Programs -- Federal funds in the amount of $60,393,000 were expended through September 1967 for housing completed under the first four programs examined. BMIR mortgages in the amount of $6,045,000 were insured by FHA through September, 1967. Of the 2,074 public housing units in New Haven only 469 were constructed after 1952. Mortgages on 482 units have insured under the BMIR program.

New Haven * Cumulative through September 30, 1967 Except for Rent Supplements Which Are Described As Of December 31, 1967

Image

* Sources: The Department of Housing and Urban Development and the New Haven Redevelopment Agency.

**Middle and moderate income units are included in the totals, particularly in the cases of the BMIR and elderly and handicapped programs.

***Dashes indicate that the column is not applicable or the program was not in existence in time period indicated by the column heading.

198. We have not included Medical Assistance to the Aged, because it is not limited to low-income persona.

199. Need -- Of the 1,670,144 residents of Detroit in 1960, 361,348, or 21.6 percent of the city's population, including 204,820 nonwhites and 156,528 whites, were members of families with annual incomes of less than $3,000.

Programs -- The estimated Federal contribution toward the four programs totalled $28,169,997. An estimated 69,310 poor persons received assistance. The average annual income of an AFDC family of four in Detroit was $1,752. By contrast, a "city worker's family budget for a moderate living standard" for a family of four in Detroit is $8,981 per year, according to the Department of Labor.

200. Need -- of the 405,220 residents of Newark in 1960, 89,949, or 22.2 percent of the city's population including 48,098 nonwhites and 41,851 whites, were members of families with annual income of less than $3,000.

Program -- The estimated Federal contribution toward the four programs totalled $14,964,647. An estimated 48,319 poor Persons received assistance. The average annual income of an AFDC family of four was $2,759. By contrast, the "city worker's family budget for a moderate living standard" for a family of four in Northern New Jersey is $10,195, according to the Department of Labor.

201. Need -- Of the 152,048 residents of New Haven in 1960, 31,254, or 20.6 percent of the city's population, including 9,021 nonwhites and 22,233 whites, were members of families with annual incomes of less than $3,000.

Programs -- The estimated Federal contribution toward the four programs totalled $3,889,487. An estimated 12,663 poor persons received assistance.

202. Data as to funding and persons reached have been obtained from Community Action Agencies (CAA's) in the three cities surveyed. Manpower and employment programs, such as Neighborhood Youth Corps, and Head Start programs have been included in other sections.

203. Need -- As indicated in the section on Welfare, in 1960 there were 361,348 people in Detroit who were members of families with annual incomes of less than $3,000.

Programs -- During fiscal year 1967, federal funds made available for community action programs, excepting manpower and Head Start, totalled $12,576,923. During that period the CAA estimates that these programs reached approximately 110,000 low-income persons.

Detroit * Fiscal Year 1967

Image

Wayne County & Detroit * Fiscal Year 1967 Wayne County

Image

Essex County & Newark * Calendar Year 1967 Essex County

Image

204. Need -- As indicated in the section on Welfare, in 1960 there were 89,949 people in Newark who were members of families with annual incomes of less than $3,000.

Programs -- During fiscal year 1967, Federal funds made available for community action programs, excepting manpower and Head Start, totalled $1,901,130. During that period the CAA estimates that these programs reached approximately 39,796 low-income persons.

Newark * Fiscal Year 1967

Image

205. Need -- As indicated in the section on Welfare, in 1960 there were 31,254 people in New Haven who were members of families with annual incomes of less than $3,000.

Programs -- Federal funds made available for community action programs, excepting manpower and Head Start, during fiscal year 1967, totalled $2,251,042. During that period the CAA estimates that these reached 13,000 low-income persons.

New Haven * Fiscal Year 1967

Image

FOOTNOTES TO CHAPTER 2-IV

GRIEVANCES


206. Using this material we bought to identify and assign weights to the four types of grievances which appeared to have the greatest significance to the Negro community in each city. We made judgments with regard to the severity of particular grievances and assigned a rank to the four most serious. These judgments were based on the frequency with which a particular grievance was mentioned, the relative intensity with which it was discussed, references to incidents exemplifying the grievance, and estimates of severity obtained from the interviewees themselves. Each priority ranking was weighted by points (4 points for the first priority, 3 for second, 2 for third and 1 for fourth). The points for each grievance for all cities were added to create an inner-city ranking. Whenever two grievances were judged to be equally serious for a particular city, the points for the two rankings involved were divided equally (e.g., in case two were judged equally suitable for the first priority, the total points for first and second were divided and each received 3-1/2 points).

Annexed are two sets of charts: Chart I shows the pervasiveness of types or grievances in 12 general categories, each of which is subdivided into several specific categories. Chart II shows only the general categories and indicates the number of times that grievances in each were ranked first, second, third, or fourth in terms of relative severity.

207. Education and recreation were ranked equally; municipal services and consumer and credit practices were also ranked equally.

208. Ibid.

209. Ibid.

210. Ibid.

211. In this survey 437 Negroes form the Detroit disturbance area were asked which of 23 grievances bad a "great deal," "something" or "nothing" to do with the riot. The grievances which received the most responses of "a great deal" were: (1) police brutality, (2) overcrowded living conditions, (3) poor housing, (4) lack of jobs, (5) poverty, and (6) anger with business people. Interviewees who identified themselves as participants in the riot were singled out for special analysis and chose the same six causes but in a slightly different order. Overcrowded living conditions was first instead of police brutality.

212. We found significant grievances concerning police practices in each of 19 cities. Grievances concerning police practices were ranked first in eight cities, second in four cities, third in none, and fourth in two cities. Although such grievances were present in five other cities, they were not ranked in the first four orders of intensity.

213. Grievances in the employment area were ranked first in three cities, second in seven cities, third in four cities, and fourth in three cities. In only three cities was such a grievance present but not ranked among the highest four levels of intensity.

214. Grievances in the housing area were found in 18 cities and were ranked first in five cities, second in two cities, third in five cities, and fourth in two cities. In four cities where housing was a grievance, it was not ranked in the first four levels of intensity.

215. Educational grievances were found in 17 cities and were ranked first in two cities, second in two cities, third in two cities, and fourth in three cities. In eight cities where such a grievance was present, it was not ranked in the first four levels of priority.

216. Grievances relating to recreation were found in 15 cities and were ranked first in three cities, second in one city, third in four cities, and fourth in none. In seven cities where such a grievance was present, it was not ranked in the first four levels of priority.

217. Grievances relating to the political structure were found in 16 cities and were ranked first m two cities, second in one city, third in one city, and fourth in one city. In 11 cities where such a grievance was present, it was not ranked in the first four levels of priority.

218. Grievances relating to white attitudes were found in 15 cities and were ranked first in no city, second in one city, third in one city, and fourth in two cities. In 11 cities where such a grievance was present, it was not ranked in the first four levels of priority.

219. Grievances relating to the administration of justice were found in 15 cities and were ranked first in no city, second in none, third in two cities, and fourth in one city. In 12 cities where such a grievance was present, it was not ranked in the first four levels of priority.

220. Grievances relating to federal programs were found in 16 cities and were ranked first in no city, second in one city, third in none, and fourth in none. In 15 cities where such a grievance was present, it was not ranked in the first four levels of priority.

221. Grievances relating to municipal services were found in 11 cities and were ranked first in no city, second m none, third in one city, and fourth in none. In 10 cities where such a grievance was present, it was not ranked in the first four levels of priority.

222. Grievances relating to unfair commercial practices were found in 11 cities and were ranked first in no city, second in none, third in none and fourth in two cities. In nine cities where such a grievance was present. it was not ranked in the first four levels of priority.

FOOTNOTES TO CHAPTER 2-V

228. We surveyed these cities shortly after the disturbances. Consequently, we are not in a position to assess more current events there. As noted elsewhere in this Report. the Commission is sponsoring two surveys which will measure the impact of the disorders on the attitudes of whites and Negroes. The surveys are being conducted in 15 cities and four suburban areas, including four of the 20 cities surveyed for this Report. The results of these surveys will be published separately and will provide a more complete treatment of the post-disorder situation.

224. We have noted earlier that no immunization took effect for the 25 cities which experienced two or more disorders in 1967. See "Levels of Violence and Damage" in Part I, supra. Six of the 20 cities we surveyed had more than one disorder (Atlanta (2) Cambridge (2), Cincinnati (3), Dayton (2), Rockford (2), and Tampa (2)). Houston bad three disorders in 1967. However, the three cities which had campus-related disorders in our sample of 23 have not been included in our examination for the purpose of this section.

225. Bridgeton, Cincinnati, Tucson (one major and two minor). In Bridgeton, a white segregationist organization had become more active. In Cincinnati and Tucson, new black organizations tended to follow militant separatist policies.

226. In Atlanta, two new groups were formed, one composed largely of white ministers and lay members, and the other of black youths. Reportedly, the latter group is dedicated to the maintenance of law and order and the prevention of riots.

In Elizabeth, as a result of its leader's anti-riot activities during the disturbance, a relatively moderate religious sect, the Orthodox Moslems, appears to nave gained stature in the Negro community.

227. In New Haven, at least two black militant organizations emerged after the riot and they seemed to have gained support from members of the moderate Negro community. In addition, an integrated group was formed several months after the riot to protect alleged police harassment and repression of the militant Negro leaders.

In Milwaukee, the NAACP Youth Commandoes, a militant but nonseparatist group, appeared to have grown in influence in the Negro community after the riot. Also, a coalition of moderate Negro leaders was formed to develop economic and social programs.

228. Atlanta, Milwaukee, New Haven, Newark, Paterson, Plainfield, Rockford and Tucson (three major, three serious, and two minor).

In New Haven, the Police Department opened a store-front office in the disturbance area where citizens could make complaints or seek assistance. The office was also designed to serve as a "cooling-off" center to avoid the need for a trip to the central stationhouse in minor matters such as domestic quarrels.

In Milwaukee, the police department established a police-community relations division.

In Newark, the Negro captain, whose promotion was announced during the riot, has been appointed commanding officer of the fourth precinct in which the disorders of the summer started.

In Paterson, the program for the police community relations unit has been expanded to include a police-community relations board consisting of seven policemen and nine civilians. The civilians include representatives from the Negro community.

In Rockford, the mayor's commission on human relations planned a workshop on police-community relations to be conducted by experts from city, county, state and federal agencies. Each member of the Rockford police force was to be required to take 12 hours of instruction.

In Tucson, the police department planned to sponsor an institute of police-community relations, including seminars on the nature of prejudice and on the attitudes of Negroes, Mexican-Americans and Indians toward the police.

In Plainfield, the police department began actively recruiting Negro officers. The department also republished its complaint procedures.

229. Cambridge Cincinnati, Detroit, Grand Rapids, New Brunswick, Paterson, Phoenix, Tampa and Tucson (three major, four serious and two minor). In Cambridge and Tampa the local community relations commissions increased their efforts to induce employers to hire more Negroes. Tampa's commission employed a full-time job developer and established a job training program.

In Grand Rapids, a coalition of public and private organizations began a crash employment program to find 1,000 jobs in three months.

In New Brunswick, the business community sought to raise $75,000 for job training; $25,000 of this amount was contributed by one local pharmaceutical company.

In Phoenix, the anti-poverty program initiated a project to train 2,500 heads of households in ghetto areas.

After the Tampa disturbance, the local anti-poverty agency and area Industries sponsored an on-the-job training program and the Tampa Merchants Association established a job training course.

230. Cambridge, Cincinnati, Dayton, Detroit, Elizabeth, Milwaukee, Plainfield, Tampa and Rockford (five major, two serious and two minor).

In Cincinnati, the urban renewal agency established a complaint office in the ghetto. The office, which was open three days a week, was closed after 38 days of operation. The city manager said the experiment was abandoned because citizens had failed to use it.

In Elizabeth, the city council approved the local housing authority's request to submit an application to the federal government for 400 low-income apartment units. The mayor also appointed a Negro to the local redevelopment agency.

In Milwaukee, the city council passed an open housing ordinance. However, Negro leaders denounced the ordinance on the ground that it merely restates the provisions of state law, which reportedly exclude 66 percent of the housing in Milwaukee from coverage. The lone Negro council member voted against the ordinance as "mere tokenism."

In Plainfield, a Negro was appointed to a five-year term as a member of the housing authority.

In Tampa, a block club staged a march on the Tampa housing authority's offices to publicize complaints against the authority, such as billing public housing residents for grass-cutting where there is no grass. The authority promised to consider the charges seriously.

In Rockford, the county housing authority is constructing a 75-unit housing development for the elderly in a Negro slum. The project was planned before the disturbance but construction began afterward. A community development corporation was also initiated before the disorder to encourage community self-help programs for home improvement, and local businesses contributed "seed money" to guarantee improvement loans. The city annexed the pilot project block in order to provide municipal services and planned to annex additional blocks as the program expands.

231. Newark is the headquarters office for two of the life insurance companies in the consortium of 350 which pledged to set aside $1 billion to finance ghetto housing under FHA insurance.

232. Dayton, Detroit, Elizabeth, Plainfield and Rockford (two major, one serious and two minor).

The Dayton board of education issued a policy statement that it would attempt to decrease de facto segregation in city schools.

Elizabeth's board of education instituted a program of free adult basic education.

The Plainfield board of education formalized its practice of permitting parents to have a third person present when talking to school officials. It also hired its first full-time Negro counsellor.

233. In Detroit, as aforementioned, the Michigan Bell Telephone Company plans to "adopt" one of the city's high schools and provide funds for special programs.

234. Atlanta, Cincinnati, Dayton and Tampa (two major and two serious). In Atlanta, despite united resistance by local Negro leaders, the administration continued to build "portable" classrooms for use at predominantly black schools, maintained double sessions only in Negro schools, and refused to reconsider its "freedom of choice" desegregation procedures. In Dayton and Tampa, bond issues for school construction were defeated. The Tampa referendum was opposed by local Negroes because most of the money was to be used in all-white, suburban schools.

Also in Tampa, the interscholastic athletic conference to which Tampa's white schools belong refused to admit the city's predominantly Negro schools to membership and made it impossible for the county schools to form a separate conference in which the Negro schools could participate in the highest class of competition.

235. Atlanta, Elizabeth, New Brunswick and Tampa (one major, one serious and two minor).

In Atlanta, immediately after the disturbance, work began on a playground for which area residents had been petitioning for two years.

In Elizabeth, shortly after the disturbance, the recreation department moved a playground closer to a poor Negro neighborhood.

In Tampa, a former local high school coach, popular among Negro youths, was hired as a director of youth services for the neighborhood service centers of the county anti-poverty program.

236. Cincinnati, Englewood, Phoenix, Tampa and Tucson (two major, one serious and two minor).

237. President of city council in Englewood, member of civil service commission in Tucson and members of housing authority and board of adjustments in Plainfield (one major and two minor).

In elections for state office, the situation was mixed. A Negro candidate for state assemblyman from Newark was elected, but two incumbent Negro legislators from Newark were defeated. The incumbent Negro assemblyman whose district included Englewood was defeated by the candidate who had been mayor of that city during the disorder.

238. Cambridge and New Brunswick (one serious and one minor).

In Cambridge, the Governor of Maryland appointed a community relations committee immediately after the disturbance.

In New Brunswick, the mayor established an "open door" policy to facilitate the airing of grievances directly with her. A human relations commission, planned prior to the disturbance, was established, and several Negroes were appointed as commissioners.

239. In Tampa, some of the counter rioters known as "White Hats" were hired by the city's commission on community relations to improve communication with ghetto youths. The program was recently terminated upon the indictment of several White Hats on felony charges not connected with the disorder.

240. Atlanta, Dayton, Detroit, Elizabeth, Englewood, New Haven, Newark and Tampa (three major, three serious and two minor).

In xix of the cities surveyed (Atlanta, Dayton, Detroit, New Haven, Newark and Tampa) Model Cities applications have been approved by the Department of Housing and Urban Development.

In Elizabeth and Tampa, new legal services programs, funded by the Office of Economic Opportunity, were instituted.

A YMHA building, valued at $50,000, near Elizabeth's disturbance area was donated for use by the local community action agency as a community center.

The county community action agency opened an office in Englewood.

241. Tampa and Milwaukee (two major).

The nomination to the board of the county community action agency of the former commander of the Milwaukee police precinct which includes much of the ghetto area was resented by Negro residents. The nomination was never voted on as the nominee moved from the city before a vote was taken.

In Tampa, a highly-publicized controversy arose because a Negro neighborhood worker was hired by a local anti-poverty agency. The discharged employee filed charges of racial discrimination in the hiring and job placement practices of the county anti-poverty program.

242. Atlanta, Dayton, Elizabeth and New Brunswick (two serious and two minor).

Elizabeth opened a "little city hall" in the disturbance area.

In New Brunswick, the administration rented an armory for use as a neighborhood center.

243. In Elizabeth, the county legal services agency announced plans for one-day consumer clinics in various low-income neighborhoods for training and counselling on complaints about credit and other consumer practices.

244. Cincinnati and Detroit (two major).

In Detroit, as stated, CCAC began developing proposals for new businesses in the riot area, including a Negro-owned cooperative food market and a number of other cooperative business ventures.

In Cincinnati, newspapers reported that two Negroes who had long sought financing for a new business center in the disturbance area had succeeded since the disturbance.

245. Atlanta, Cincinnati, Detroit, Newark and Tampa (four major and one serious).

In Atlanta, the police and fire departments announced the formulation of a confidential coordinated plan to cope with any future disturbance.

In Cincinnati, voters approved a bond issue to establish a countrywide police communications center and command post for normal conditions as well as riot conditions. The new city budget included $500,000 for 50 additional policemen.

In Newark, the city council appropriated $200,000 for the purchase of armored cars, riot guns, helmets and other riot control equipment.

In Tampa city and county law enforcement departments prepared a detailed "After-action Report" describing the city s disorder and how it was controlled. The report recommended purchase of riot control equipment and suggested tactical improvements.

246. Dayton, Elizabeth, Paterson and Tampa (one major, two serious and one minor).

In Dayton, the organizers of the White Hats stated that the group would be used again if another riot occurred. The organizers also stated that they expected city officials to cooperate with them again as they had during the June disorder.

In Elizabeth, there was evidence that city officials planned to ask Negro Community leaders to assist in future peace keeping as they did during the disorder.

In Paterson, the community action agency gave a leadership course for Negro teenagers in the hope that the youths will act as counter-rioters should the need arise.

247. In Tampa, as indicated above, the White Hats program, which had been continued after the disorder, ended with the indictment of several youths on non-riot-connected charges.

248. In Cincinnati, according to unofficial estimates, about 50 percent of the businesses damaged during that city's riot bad reopened by mid-December, 1967.

In Dayton, where the total estimated property damage from the June disorder was relatively small, most of the storefronts damaged on the West Dayton business area were repaired.

249. Detroit and Plainfield (two major).

In Plainfield, two Negro organizations demanded that any new building be undertaken only after consultation with representatives of the Negro community.

In Detroit, CCAC insisted that no rebuilding be started until Negro citizens of the area decided how they want their neighborhoods redeveloped.

_______________  

Notes:

i. Notes appear at end of chapter.

ii. See the statement on Methodology in the Appendix for a description of our survey procedures.
admin
Site Admin
 
Posts: 36230
Joined: Thu Aug 01, 2013 5:21 am

Re: Report of the National Advisory (Kerner Report 1967)

Postby admin » Mon May 02, 2016 10:05 am

Chapter 3: Organized Activity The President directed the Commission to investigate "to what extent, if any, there has been planning or organization in any of the riots."

The President further directed the Federal Bureau of Investigation to provide investigative information and assistance to the Commission and authorized the Commission to request from any other executive department or agency any information and assistance which the Commission deemed necessary to carry out its functions.

The Commission obtained documents, numbering in the thousands, from the Federal Bureau of Investigation, the Department of State, the Department of Defense, the Department of the Treasury, the Internal Revenue Service, the Post Office Department, the Legislative Reference Service of the Library of Congress, and the Central Intelligence Agency. The Commission established a special investigating staff supplementing the Commission's field teams and related staff that made the general examination of the riots in 23 cities. The special investigating staff examined the data supplied by the field team, by the several federal agencies, and by congressional investigating units, and maintained continuous liaison with these organizations throughout its investigation.

In addition to examining and evaluating intelligence and information from federal sources, the special investigating staff gathered information from local and state law enforcement agencies and officials. It also conducted its own field investigations in 15 cities with special emphasis on five that had experienced major disorders in 1967 -- Cincinnati, Newark, Detroit, Milwaukee, and New Haven. Special staff investigators employed by the Commission interviewed over 400 persons. including police officials, black militants, and ghetto residents.

The Commission studied the role of foreign and domestic organizations, and individuals, dedicated to the incitement or encouragement of violence. It considered the organizational affiliations of those who called for violence, their contacts, sources of financial support, travel schedules and, so far as possible, their effect on audiences.

The Commission considered the incidents that had triggered the disorders and the patterns of damage during disorders, particularly in Newark and Detroit. The Commission analyzed the extent of sniper activity and the use of fire bombs.

The Commission collected and investigated hundreds of rumors relating to possible organized activity. These included reports of arms caches, sniper gangs, guerrilla training camps, selection of targets for destruction, movement of armed individuals from one riot area to another, and pre-riot planning.

On the basis of all the information collected the Commission concludes that the urban disorders of the summer of 1967 were not caused by, nor were they the consequence of, any organized plan or "conspiracy." Specifically, the Commission has found no evidence that all or any of the disorders or the incidents that led to them were planned or directed by any organization or group, international, national or local.

Militant organizations, local and national, and individual agitators, who repeatedly forecast and called for violence, were active in the spring and summer of 1967. We believe that they deliberately sought to encourage violence, and that they did have an effect in creating an atmosphere that contributed to the outbreak of disorder.

We recognize that the continuation of disorders and the polarization of the races would provide fertile ground for organized exploitation in the future.

Since the disorders, intensive investigations have been conducted not only by this Commission but also by local police departments, grand juries, city and state committees, federal departments and agencies, and congressional committees. None thus far has identified any organized groups as having initiated any riots during the summer of 1967. The Commission appointed by Governor Richard J. Hughes to examine the disorders in New Jersey was unable to find evidence supporting a conclusion that there was a conspiracy or plan to organize the Newark or Plainfield riots.

Investigations are continuing at all levels of government, including committees of Congress. These investigations relate not only to the disorders of 1967 but also to the actions of groups and individuals, particularly in schools and colleges, during this last fall and winter. The Commission has cooperated in these investigations. They should continue.
admin
Site Admin
 
Posts: 36230
Joined: Thu Aug 01, 2013 5:21 am

Re: Report of the National Advisory (Kerner Report 1967)

Postby admin » Mon May 02, 2016 10:09 am

PART 2: WHY DID IT HAPPEN?

Chapter 4: The Basic Causes

We have seen what happened. Why did it happen?


In addressing this question we shift our focus from the local to the national scene, from the particular events of the summer of 1967 to the factors within the society at large which have brought about the sudden violent mood of so many urban Negroes.

The record before this Commission reveals that the causes of recent racial disorders are imbedded in a massive tangle of issues and circumstances -- social, economic, political, and psychological -- which arise out of the historical pattern of Negro-white relations in America.

These factors are both complex and interacting; they vary significantly in their effect from city to city and from year to year; and the consequences of one disorder, generating new grievances and new demands, become the causes of the next. It is this which creates the "thicket of tension, conflicting evidence and extreme opinions" cited by the President.

Despite these complexities, certain fundamental matters are clear. Of these, the most fundamental is the racial attitude and behavior of white Americans toward black Americans. Race prejudice has shaped our history decisively in the past; it now threatens to do so again. White racism is essentially responsible for the explosive mixture which has been accumulating in our cities since the end of World War II. At the base of this mixture are three of the most bitter fruits of white racial attitudes:

Pervasive discrimination and segregation. The first is surely the continuing exclusion of great numbers of Negroes from the benefits of economic progress through discrimination in employment and education, and their enforced confinement in segregated housing and schools. The corrosive and degrading effects of this condition and the attitudes that underlie it are the source of the deepest bitterness and at the center of the problem of racial disorder.

Black migration and white exodus. The second is the massive and growing concentration of impoverished Negroes in our major cities resulting from Negro migration from the rural South, rapid population growth and the continuing movement of the white middle-class to the suburbs. The consequence is a greatly increased burden on the already depleted resources of cities, creating a growing crisis of deteriorating facilities and services and unmet human needs.

Black ghettos. Third, in the teeming racial ghettos, segregation and poverty have intersected to destroy opportunity and hope and to enforce failure. The ghettos too often mean men and women without jobs, families without men, and schools where children are processed instead of educated, until they return to the street -- to crime, to narcotics, to dependency on welfare, and to bitterness and resentment against society in general and white society in particular.

These three forces have converged on the inner city in recent years and on the people who inhabit it. At the same time, most whites and many Negroes outside the ghetto have prospered to a degree unparalleled in the history of civilization. Through television -- the universal appliance in the ghetto -- and the other media of mass communications, this affluence has been endlessly flaunted before the eyes of the Negro poor and the jobless ghetto youth.

As Americans, most Negro citizens carry within themselves two basic aspirations of our society. They seek to share in both the material resources of our system and its intangible benefits -- dignity, respect and acceptance. Outside the ghetto many have succeeded in achieving a decent standard of life, and in developing the inner resources which give life meaning and direction. Within the ghetto, however, it is rare that either aspiration is achieved.

Yet these facts alone-fundamental as they are -- cannot be said to have caused the disorders. Other and more immediate factors help explain why these events happened now. Recently, three powerful ingredients have begun to catalyze the mixture.

Frustrated hopes. The expectations aroused by the great judicial and legislative victories of the civil rights movement have led to frustration, hostility and cynicism in the face of the persistent gap between promise and fulfillment. The dramatic struggle for equal rights in the South has sensitized Northern Negroes to the economic inequalities reflected in the deprivations of ghetto life.

Legitimation of violence. A climate that tends toward the approval and encouragement of violence as a form of protest has been created by white terrorism directed against nonviolent protest, including instances of abuse and even murder of some civil rights workers in the South; by the open defiance of law and federal authority by state and local officials resisting desegregation; and by some protest groups engaging in civil disobedience who turn their backs on nonviolence, go beyond the Constitutionally protected rights of petition and free assembly, and resort to violence to attempt to compel alteration of laws and policies with which they disagree. This condition has been reinforced by a general erosion of respect for authority in American society and reduced effectiveness of social standards and community restraints on violence and crime. This in turn has largely resulted from rapid urbanization and the dramatic reduction in the average age of the total population.

Powerlessness. Finally, many Negroes have come to believe that they are being exploited politically and economically by the white "power structure." Negroes, like people in poverty everywhere, in fact lack the channels of communication, influence and appeal that traditionally have been available to ethnic minorities within the city and which enabled them -- unburdened by color -- to scale the walls of the white ghettos in an earlier era. The frustrations of powerlessness have led some to the conviction that there is no effective alternative to violence as a means of expression and redress, as a way of "moving the system." More generally, the result is alienation and hostility toward the institutions of law and government and the white society which controls them. This is reflected in the reach toward racial consciousness and solidarity reflected in the slogan "Black Power."

These facts have combined to inspire a new mood among Negroes, particularly among the young. Self-esteem and enhanced racial pride are replacing apathy and submission to "the system." Moreover, Negro youth, who make up over half of the ghetto population, share the growing sense of alienation felt by many white youth in our country. Thus, their role in recent civil disorders reflects not only a shared sense of deprivation and victimization by white society but also the rising incidence of disruptive conduct by a segment of American youth throughout the society.

Incitement and encouragement of violence. These conditions have created a volatile mixture of attitudes and beliefs which needs only a spark to ignite mass violence. Strident appeals to violence, first heard from white racists, were echoed and reinforced last summer in the inflammatory rhetoric of black racists and militants. Throughout the year, extremists crisscrossed the country preaching a doctrine of black power and violence. Their rhetoric was widely reported in the mass media; it was echoed by local "militants" and organizations; it became the ugly background noise of the violent summer.

We cannot measure with any precision the influence of these organizations and individuals in the ghetto, but we think it clear that the intolerable and unconscionable encouragement of violence heightened tensions, created a mood of acceptance and an expectation of violence, and thus contributed to the eruption of the disorders last summer.

The Police. It is the convergence of all these factors that makes the role of the police so difficult and so significant. Almost invariably the incident that ignites disorder arises from police action. Harlem, Watts, Newark and Detroit -- all the major outbursts of recent years -- were precipitated by routine arrests of Negroes for minor offenses by white police.

But the police are not merely the spark. In discharge of their obligation to maintain order and insure public safety in the disruptive conditions of ghetto life, they are inevitably involved in sharper and more frequent conflicts with ghetto residents than with the residents of other areas. Thus, to many Negroes police have come to symbolize white power, white racism and white repression. And the fact is that many police do reflect and express these white attitudes.. The atmosphere of hostility and cynicism is reinforced by a widespread perception among Negroes of the existence of police brutality and corruption, and of a "double standard" of justice and protection--one for Negroes and one for whites.

* * *

To this point, we have attempted only to identify the prime components of the "explosive mixture." In the chapters that follow we seek to analyze them in the perspective of history. Their meaning, however, is already clear:

In the summer of 1967, we have seen in our cities a chain reaction of racial violence. If we are heedless, we shall none of us escape the consequences.
admin
Site Admin
 
Posts: 36230
Joined: Thu Aug 01, 2013 5:21 am

Re: Report of the National Advisory (Kerner Report 1967)

Postby admin » Mon May 02, 2016 11:11 am

Part 1 of 2

Chapter 5: Rejection and Protest: An Historical Sketch

INTRODUCTION


The events of the summer of 1967 are in large part the culmination of 300 years of racial prejudice. Most Americans know little of the origins of the racial schism separating our white and Negro citizens. Few appreciate how central the problem of the Negro has been to our social policy. Fewer still understand that today's problems can be solved only if white Americans comprehend the rigid social, economic, and educational barriers that have prevented Negroes from participating in the mainstream of American life. Only a handful realize that Negro accommodation to the patterns of prejudice in American culture has been but one side of the coin -- for as slaves and as free men, Negroes have protested against oppression and have persistently sought equality in American society.

What follows is neither a history of the Negro in the United States nor a full account of Negro protest movements. Rather, it is a brief narrative of a few historical events that illustrate the facts of rejection and the forms of protest.

We call on history not to justify, but to help explain, for black and white Americans, a state of mind.

THE COLONIAL PERIOD

Twenty years after Columbus reached the New World, African Negroes, transported by Spanish, Dutch, and Portuguese traders, were arriving in the Caribbean Islands. Almost all came as slaves. By 1600, there were more than half a million slaves in the Western Hemisphere.

In Colonial America the first Negroes landed at Jamestown in August 1619. Within 40 years Negroes had become a group apart, separated from the rest of the population by custom and law. Treated as servants for life, forbidden to intermarry with whites, deprived of their African traditions, and dispersed among Southern plantations, American Negroes lost tribal, regional, and family ties.

Through massive importation, their numbers increased rapidly. By 1776, some 500,000 Negroes were held in slavery and indentured servitude in the United States. Nearly one of every six persons in the country was a slave.

Americans disapproved a preliminary draft of the Declaration of Independence that indicted the King of England for waging "cruel war against human nature itself, violating its most sacred rights of life and liberty in the persons of a distant people who never offended him, captivating and carrying them into slavery in another hemisphere, or to incur miserable death in their transportation thither." Instead, they approved a document that proclaimed "all men are created equal."

The statement was an ideal, a promise. But it excluded the Negroes who were held in bondage, as well as the few who were free men.

The conditions in which Negroes lived had already led to protest. Throughout the 18th century, the danger of Negro revolts obsessed many white Americans. Slave plots of con- siderable scope were uncovered in New York in 1712 and 1741, and they resulted in bloodshed -- whites and Negroes were slain.

Racial violence was present almost from the beginning of the American experience.

THE REVOLUTION

Negroes were at first barred from serving in the Revolutionary Army, recruiting officers having been ordered in July 1775 to enlist no "stroller, Negro, or vagabond." Yet Negroes were already actively involved in the struggle for independence. Crispus Attucks, a Boston Negro, was perhaps the first American to die for freedom, and Negroes had already fought in the battles at Lexington and Concord. They were among the soldiers at Bunker Hill.

Fearing that Negroes would enlist in the British Army, which welcomed them, and facing a manpower shortage, the Continental Army accepted free Negroes. Slaves joined the British, and according to an estimate by Thomas Jefferson, more than 30,000 Virginia slaves ran away in 1778 alone, presumably to enlist. The states were enrolling both free and slave Negroes, and finally Congress authorized military service for slaves, who were to be emancipated in return for their service. By the end of the war, about 5,000 Negroes had been in the ranks of the Continental Army. Those who had been slaves became free.

But the liberty and equality implicit in American independence had meaning rather than application to them.

THE CONSTITUTION AND THE LAWS

Massachusetts abolished slavery in 1783, and Connecticut, Rhode Island, New Jersey, Pennsylvania, and New York soon provided for gradual liberation. But relatively few Negroes lived in these states. The bulk of the Negro population was in the South, where white Americans had fortunes invested in slaves. Although the Congress banned slavery in the Northwest Territory, delegates at the Constitutional Convention compromised with the institution -- a slave counted as three-fifths of a person for determining the number of representatives from a state to Congress; Congress was prohibited from restricting the slave trade until after 1808, and the free states were required to return fugitive slaves to their Southern owners.

Growing numbers of slaves in the South became permanently fastened in bondage, and slavery spread into the new Southern regions. When more slaves were needed for the cotton and sugar plantations in the Southwest, they were ordered from the "Negro-raising" states of the Old South or, despite Congressional prohibition of the slave trade, imported from Africa.

The laws of bondage became even more institutionalized. Masters retained absolute authority over their Negroes, who were unable to leave their masters' properties without written permission. Any white person, even those who owned no slaves -- and they outnumbered slaveholders six to one -- could challenge a truant slave and turn him over to a public official. Slaves could own no property, could enter into no contract, not even a contract of marriage, and had no right to assemble in public unless a white person was present. They had no standing in the courts. Without legal means of defense, slaves were susceptible to the premise that any white person could threaten their lives or take them with impunity.

DISCRIMINATION AS DOCTRINE

The situation was hardly better for free Negroes. A few achieved material success, several owned slaves themselves, but the vast majority knew only poverty and suffered the indignity of rejection by white society. Forbidden to settle in some areas, segregated in others, they were targets of prejudice and discrimination. In the South, they were denied freedom of movement, severely restricted in their choice of occupation, and forbidden to associate with whites or with slaves. They lived in constant danger of being enslaved -- whites could challenge their freedom and an infraction of the law could put them into bondage. In both North and South, they were regularly victims of mobs. In 1829, for example, white residents invaded Cincinnati's "Little Africa," killed Negroes, burned their property, and ultimately drove half the colored population from the city.

Some Americans, Washington and Jefferson among them, advocated the gradual emancipation of slaves, and in the 19th century, a movement to abolish slavery grew in importance and strength. A few white abolitionist leaders wanted full equality for Negroes, but others sought only to eliminate the institution itself. And some anti-slavery societies, fearing that Negro members would unnecessarily offend those who were unsympathetic with abolitionist principles, denied entrance to Negro abolitionists.

Most Americans were, in fact, against abolishing slavery. They refused to rent their halls for anti-slavery meetings. They harassed abolitionist leaders who sought to educate white and Negro children together. They attacked those involved in the movement. Mobs sometimes killed abolitionists and destroyed their property.

A large body of literature came into existence to prove that the Negro was imperfectly developed in mind and body, that he belonged to a lower order of man, that slavery was right on ethnic, economic, and social grounds -- and quoted the Scriptures in support.

Spreading rapidly during the first part of the 19th century, the institution enslaved less than one million Negroes in 1800, but almost four million in 1860. Although some few white Americans had freed their slaves, most increased their holdings, for the invention of the cotton gin had made the cotton industry profitable. In mid-century, slavery in the South was a systematic and aggressive way of treating a whole race of people.

The despair of Negroes was evident. Malingering and sabotage tormented every slaveholder. The problem of runaway slaves was endemic. Some slaves -- Gabriel Prosser in 1800, Denmark Vesey in 1822, Nat Turner in 1831, and others -- turned to violence, and the sporadic uprisings that flared demonstrated a deep protest against a demeaning way of life.

Negroes who had material resources expressed their distress in other ways. Paul Cuffee, Negro philanthropist and owner of a fleet of ships, transported in 1816 a group of Negroes to a new home in Sierra Leone. Forty years later Martin R. Delany, Negro editor and physician urged Negroes to settle elsewhere. When Frederick Douglass, the distinguished Negro abolitionist, addressed the citizens of Rochester on Independence Day, 1852, he told them:

The Fourth of July is yours, not mine. You may rejoice, I must mourn. To drag a man into the grand illuminated temple of liberty, and call upon him to join you in joyous anthems, were inhuman mockery and sacrilegious irony.... Fellow citizens, above your national tumultuous joy, I hear the mournful wail of millions, whose chains, heavy and grievous yesterday, are today rendered more intolerable by the jubilant shouts that reach them....


THE PATH TOWARD CIVIL WAR

The 1850's brought Negroes increasing despair, as the problem of slavery was debated by the nation's leaders. The Compromise of 1850 and the Kansas-Nebraska Act of 1854 settled no basic issues. And the Dred Scott case in 1857 confirmed Negroes in their understanding that they were not "citizens" and thus not entitled to the Constitutional safeguards enjoyed by other Americans.

But the abolitionist movement was growing. "Uncle Tom's Cabin" appeared in 1852 and sold more than 300,000 copies that year. Soon presented on the stage throughout the North, it dramatized the cruelty of slave masters and overseers and condemned a culture based on human degradation and exploitation. John Brown's raids, then the election of Abraham Lincoln to the Presidency on an anti-slavery platform gave hope that the end of slavery was near.

But by the time Lincoln took office, seven Southern states had seceded from the Union, and four more soon joined them. Even the abolitionist movement had disappointed perceptive Negroes who saw that white leaders were less than altogether sincere. A few were genuinely interested in the Negro, but most were paternalistic and prejudiced. Whites were motivated at best by pity, at worst by economic self-interest.

Equality of treatment and acceptance by the society at large were myths, and Negro protest during the first half of the 19th century took the form of rhetoric, spoken and written, which combined denunciation of undemocratic oppression together with pleas to the conscience of white Americans for the redress of grievances and the recognition of their constitutional rights.

A few Negroes joined white Americans who believed that only Negro emigration to Africa would solve racial problems. But most Negroes equated that program with banishment and felt themselves "entitled to participate in the blessings" of America. The National Negro Convention Movement, formed in 1830, held conferences to publicize on a national scale the evils of slavery and the indignities heaped on free Negroes.

The American Moral Reform Society, founded by Negroes in 1834, rejected racial separatism and advocated uplifting "the whole human race, without distinction as to . . • complexion." Other Negro reformers pressed for stronger racial consciousness and solidarity as the means to overcome racial barriers. Many took direct action to help slaves escape through the Underground Railroad. A few resisted discrimination by political action, even though most Negroes were barred from voting. Some few called for, but made no effort to organize, slave rebellions and mass violence.

Frustration, disillusionment, anger, and fantasy marked the Negro protest against the place in American society assigned to them. "I was free," Harriet Tubman said, "but there was no one to welcome me in the land of freedom. I was a stranger m a strange land."

The Civil War and Emancipation renewed Negro faith in the vision of a racially egalitarian and integrated American society. But Americans, after having been roused by wartime crisis, would again fail to destroy what abolitionists had described as the "sins of caste."

CIVIL WAR AND "EMANCIPATION"

Negroes volunteered for military service during the Civil War, the struggle, as they saw it, between the slave states and the free states. They were rejected.

Not until a shortage of troops plagued the Union Army late in 1862, were segregated units of "United States Colored Troops" formed. Not until 1864 did these men receive the same pay as white soldiers. A total of 186,000 Negroes served.

The Emancipation Proclamation of 1863 freed few slaves at first, but had immediate significance as a symbol. Negroes could hope again for equality.

But there were, at the same time, bitter signs of racial unrest. Violent rioting occurred in Cincinnati in 1862, when Negro and Irish hands competed for work on the riverboats. Lesser riots took place in Newark, New Jersey, and in Buffalo and Troy, New York, the result of combined hostility to the war and fear that Negroes would take white jobs.

The most violent of the troubles took place in New York City Draft Riots in July 1863, when white workers, mainly Irish-born, embarked on a three-day rampage.

Desperately poor and lacking real roots in the community, they had the most to lose from the draft. Further, they were bitterly afraid that even cheaper Negro labor would flood the North if slavery ceased to exist.

All the frustrations and prejudices the Irish had suffered were brought to a boiling point.... At pitiful wages, they had slaved on the railroads and canals, had been herded into the most menial jobs as carters and stevedores.... Their crumbling frame tenements ... were the worst slums in the city.


Their first target was the office of the provost-marshal in charge of conscription, and 700 people quickly ransacked the building and set it on fire. The crowd refused to permit firemen into the area, and the whole block was gutted. Then the mob spilled into the Negro area, where many were slain and thousands forced to flee town. The police were helpless until federal troops arrived on the third day and restored control.

Union victory in the Civil War promised the Negroes freedom but hardly equality or immunity from white aggression. Scarcely was the war ended when racial violence erupted in New Orleans. Negroes proceeding to an assembly hall to discuss the franchise were charged by police and special troops, who routed the Negroes with guns, bricks, and stones, killed some at once, pursued and killed others who were trying to escape.

Federal troops restored order. But 34 Negroes and four whites were reported dead and over 200 people were injured. General Sheridan later said:

At least nine-tenths of the casualties were perpetrated by the police and citizens by stabbing and smashing in the heads of many who had already been wounded or killed by policemen... it was not just a riot but 'an absolute massacre by the police ...' a murder which the mayor and police ... perpetrated without the shadow of necessity.


RECONSTRUCTION

Reconstruction was a time of hope, the period when the 13th, 14th, and 15th Amendments were adopted, giving Negroes the vote and the promise of equality.

But campaigns of violence and intimidation accompanied these optimistic expressions of a new age, as the Ku Klux Klan and other secret organizations sought to suppress the emergence into society of the new Negro citizens. Major riots occurred in Memphis, Tennessee, where 46 Negroes were reported killed and 75 wounded, and in the Louisiana centers of Colfax and Coushatta, where more than 100 Negro and white Republicans were massacred.

Nevertheless, reconstruction reached a legislative climax in 1875 with passage of the first Civil Rights law. Negroes now had the right to equal accommodations, facilities, and advantages of public transportation, inns, theaters, and places of public amusement, but the law had no effective enforcement provisions and was, in fact, poorly enforced. Although bills to provide federal aid to education for Negroes were prepared, none passed, and educational opportunities remained meager.

But Negroes were elected to every Southern legislature, 20 served in the U.S. House of Representatives, two represented Mississippi in the U.S. Senate, and a prominent Negro politician was Governor of Louisiana for 40 days.

Opposition to Negroes in state and local government was always open and bitter. In the press and on the platform they were described as ignorant and depraved. Critics made no distinction between Negroes who had graduated from Dartmouth and those who had graduated from the cotton fields. Every available means Was employed to drive Negroes from public life. Negroes who voted or held office were refused jobs or punished by the Ku Klux Klan. One group in Mississippi boasted of having killed 116 Negroes and of having thrown their bodies into the Tallahatchie River. In a single South Carolina county, six men were murdered and more than 300 whipped during the first six months of 1870.

The federal government seemed helpless. Having withdrawn the occupation troops as soon as the Southern states organized governments, the President was reluctant to send them back. In 1870 and 1871, after the 15th Amendment was ratified, Congress enacted several laws to protect the right of citizens to vote. They were seldom enforced, and the Supreme Court struck down most of the important provisions in 1875 and 1876.

THE END OF RECONSTRUCTION

As Southern white governments returned to power, beginning with Virginia in 1869 and ending with Louisiana in 1877, the program of relegating the Negro to a subordinate place in American life was accelerated. Disenfranchisement was the first step. Negroes who defied the Klan and tried to vote faced an array of deceptions and obstacles -- polling places were changed at the last minute without notice to Negroes, severe time limitations were imposed on marking complicated ballots, votes cast incorrectly in a maze of ballot boxes were nullified. The suffrage provisions of state constitutions were rewritten to disenfranchise Negroes who could not read, understand, or interpret the Constitution. Some state constitutions permitted those who failed the tests to vote if their ancestors had been eligible to vote on January 1, 1860, when no Negro could vote anywhere in the South.

In 1896, Negroes registered in Louisiana totalled 130,344. In 1900, after the state rewrote the suffrage provisions of its constitution, Negroes on the registration books numbered only 5,320. Essentially the same thing happened in the other states of the former Confederacy.

SEGREGATION BY LAW

When the Supreme Court, in 1883, declared the Civil Rights Act of 1875 unconstitutional, Southern states began to enact laws to segregate the races. In 1896, the Supreme Court in Plessy v. Ferguson approved "separate but equal" facilities; it was then that segregation became an established fact, by law and by custom. Negroes and whites were separated on public carriers and in all places of public accommodation, including hospitals and churches. In courthouses, whites and Negroes took oaths on separate Bibles. In most communities, whites were separated from Negroes in cemeteries.

Segregation invariably meant discrimination. On trains all Negroes, including those holding first-class tickets, were allotted a few seats in the baggage car. Negroes in public buildings had to use freight elevators and toilet facilities reserved for janitors. Schools for Negro children were at best a weak imitation of those for whites, as states spent 10 times more to educate white youngsters than Negroes. Discrimination in wages became the rule, whether between Negro and white teachers of similar training and experience or between common laborers on the same job.

Some Northern states enacted civil rights laws in the 1880's, but Negroes in fact were treated little differently in the North than in the South. As Negroes moved north in substantial numbers toward the end of the century, they discovered that equality of treatment was only a dream in Massachusetts, New York, or Illinois. They were crowded by local ordinances into one section of the city where housing and public services were generally sub-standard. Overt discrimination in employment was a general practice. Employment opportunities apart from menial tasks were few. Most labor unions excluded Negroes from membership -- or granted membership in separate and powerless Jim Crow locals. Yet when Negroes secured employment during strikes, labor leaders castigated them for not understanding the principles of trade unionism. And when Negroes sought to move into the mainstream of community life by seeking membership in the organizations around them -- educational, cultural, and religious -- they were invariably rebuffed.

That northern whites would resort to violence was made clear in anti-Negro riots in New York, 1900; Springfield, Ohio, 1904; Greensburg, Indiana, 1906; Springfield, Illinois, 1908.

The latter was a three-day riot, initiated by a white woman's claim of violation by a Negro, inflamed by newspapers, intensified by crowds of whites gathered around the jail demanding that the Negro, arrested and imprisoned, be lynched. When the sheriff transferred the accused and another Negro to a jail in a nearby town, rioters headed for the Negro section and attacked homes and businesses owned by or catering to Negroes. White owners who showed handkerchiefs in their windows averted harm to their stores. One Negro was summarily lynched, others were dragged from houses and streetcars and beaten. By the time National Guardsmen could reach the scene, six persons were dead -- four whites and two Negroes; property damage was extensive. Many Negroes left Springfield, hoping to find better conditions elsewhere, especially in Chicago.

By the 20th century, the Negro was at the bottom of American society. Disfranchised, Negroes throughout the country were excluded by employers and labor unions from white collar jobs and skilled trades. Jim Crow laws and farm tenancy characterized Negro existence in the South. About 100 lynchings occurred every year in the 1880's and 1890's; there were 161 lynchings in 1892. As increasing numbers of Negroes migrated to Northern cities, race riots became commonplace. Northern whites, even many former abolitionists, began to accept the white South's views on race relations.

BOOKER T. WASHINGTON

Between his famous Atlanta Exposition Address in 1895 and his death in 1915, Booker T. Washington, principal of the Tuskegee Normal and Industrial Institute in Alabama and the most prominent Negro in America. secretly spent thousands of dollars fighting disfranchisement and segregation laws; publicly he advocated a policy of accommodation, conciliation, and gradualism. Largely blaming Negroes themselves for their condition, Washington believed that by helping themselves, by creating and supporting their own businesses, by proving their usefulness to society through the acquisition of education, wealth, and morality, Negroes would earn the respect of the white man and thus eventually gain their constitutional rights.

Self-help and self-respect appeared a practical and sure, if gradual, way of ultimately achieving racial equality. Washington's doctrines also gained support because they appealed to race pride -- if Negroes believed in themselves, stood together, and supported each other, they would be able to shape their destinies.

THE NIAGARA MOVEMENT

In the early years of the century, a small group of Negroes, led by W.E.B. Du Bois, formed the Niagara Movement to oppose Washington's program, which they claimed had failed. Washington had put economic progress before politics, had accepted the separate-but-equal theory, and opposed agitation and protest. Du Bois and his followers stressed political activity as the basis of the Negro's future, insisted on the inequity of Jim Crow laws, and advocated agitation and protest.

In sharp language, the Niagara group placed responsibility for the race problem squarely on the whites. The aims of the movement were voting rights and "the abolition of an caste distinctions based simply on race and color."

Although Booker T. Washington tried to crush his critics, Du Bois and the Negro "radicals," as they were called, enlisted the support of a small group of influential white liberals and socialists. Together, in 1909-1910, they formed the National Association for the Advancement of Colored People.

THE NAACP

The NAACP hammered at the walls of prejudice by organizing Negroes and well-disposed whites, by aiming propaganda at the whole nation, by taking legal action in courts and legislatures. Almost at the outset of its career, the NAACP prevailed upon the Supreme Court to declare unconstitutional two discriminatory statutes. In 1915, the Court overruled the Oklahoma "grandfather clause," a provision in several Southern state constitutions that excluded from the vote those whose ancestors were ineligible to vote in 1860. Two years later, the Supreme Court outlawed municipal residential segregation ordinances. These NAACP victories were the first legal steps in a long fight against disfranchisement and segregation.

THE FEDERAL GOVERNMENT

During the first quarter of the 20th century, the federal government enacted no new legislation to ensure equal rights or opportunities for Negroes and made little attempt to enforce existing laws despite flagrant violations of Negro civil rights.

In 1913, members of Congress from the South introduced bills to federalize the Southern segregation policy. They wished to ban interracial marriages in the District of Columbia, segregate white and Negro federal employees, and introduce Jim Crow laws in the public carriers of the District. The bills did not pass, but segregation practices were extended in federal offices, shops, restrooms, and lunchrooms. The nation's capital became as segregated as any in the former Confederate states.

EAST ST. LOUIS, 1917

Elsewhere there was violence. In East St. Louis, Illinois, a riot in July 1917 claimed the lives of 39 Negroes and nine whites, as a result of fear by white working men that Negro advances in economic, political and social status were threatening their own security and status.

When the labor force of an aluminum plant went on strike, the company hued Negro workers. A labor union delegation called on the mayor and asked that further migration of Negroes to East St. Louis be stopped. As the men were leaving City Hall, they heard that a Negro had accidentally shot a white man during a holdup. In a few minutes rumor had replaced fact: the shooting was intentional -- a white woman had been insulted -- two white girls were shot. By this time 3,000 people had congregated and were crying for vengeance. Mobs roamed the streets, beating Negroes. Policemen did little more than take the injured to hospitals and disarm Negroes.

The National Guard restored order. When the governor withdrew the troops, tensions were still high, and scattered episodes broke the peace. The press continued to emphasize the incidence of Negro crimes, white pickets and Negro workers at the aluminum company skirmished and, on July 1, some whites drove through the main Negro neighborhood firing into homes. Negro residents armed themselves. When a police car drove down the street Negroes riddled it with gunshot.

The next day a Negro was shot on the main street and a new riot was underway. The authority on the event records that the area became a "bloody half mile" for three or four hours; streetcars were stopped, and Negroes, without regard to age or sex, were pulled off and stoned, clubbed and kicked, and mob leaders calmly shot and killed Negroes who were lying in blood in the street. As the victims were placed in an ambulance, the crowds cheered and applauded.

Other rioters set fire to Negro homes, and by midnight the Negro section was in flames and Negroes were fleeing the city. There were 48 dead, hundreds injured, and more than 300 buildings destroyed.

WORLD WAR I

When the United States entered World War I in 1917, the country again faced the question whether American citizens should have the right to serve, on an equal basis, in defense of their country. More than two million Negroes registered under the Selective Service Act, and some 360,000 were called into service.

The Navy rejected Negroes except as menials. The Marine Corps rejected them altogether. The Army formed them into separate units commanded, for the most part, by white officers. Only after enormous pressure did the Army permit Negro candidates to train as officers in a segregated camp. Mistreated at home and overseas, Negro combat units performed exceptionally well under French commanders, who refused to heed American warnings that Negroes were inferior people.

Mobbed for attempting to use facilities open to white soldiers, Negro soldiers returning home suffered indignities. Of the 70 Negroes lynched during the first year after the war, a substantial number were soldiers. Some were lynched in uniform.

POSTWAR VIOLENCE

Reorganized in 1915, the Ku Klux Klan was flourishing again by 1919. Its program "for uniting native-born white Christians for concerted action in the preservation of American institutions and the supremacy of the white race," was implemented by flogging, branding with acid, tarring and feathering, hanging and burning. It destroyed the elemental rights of many Negroes, and of some whites.

Violence took the form of lynchings and riots, and major riots by whites against Negroes took place in 1917 in Chester, Pennsylvania, and Philadelphia; in 1919 in Washington, D.C., Omaha, Charleston, Longview, Texas, Chicago, and Knoxville; in 1921 in Tulsa.

The Chicago riot of 1919 flared from the increase in Negro population, which had more than doubled in 10 years. Jobs were plentiful, but housing was not. Black neighborhoods expanded into white sections of the city, and trouble developed. Between July 1917 and March 1921, 58 Negro houses were bombed, and recreational areas were sites of racial conflict.

The riot itself started on Sunday, July 27, with stone throwing and sporadic fighting at adjoining white and Negro beaches. A Negro boy swimming off the Negro beach drifted into water reserved for whites and drowned. Young Negroes claimed he had been struck by stones and demanded the arrest of a white man. Instead, police arrested a Negro. When Negroes attacked policemen, a riot was in the making. News spread to the city, white and Negro groups clashed in the streets, two persons died, and 50 were wounded. On Monday, Negroes coming home from work were attacked; later, when whites drove cars through Negro neighborhoods and fired weapons, Negroes retaliated. Twenty more were killed and hundreds wounded. On Tuesday, a handful more were dead, 129 injured. On Wednesday, losses in life and property declined further. Rain began to fall; the mayor finally called in the state militia. After nearly a week of violence, the city quieted down.

THE 1920's AND THE NEW MILITANCY

In. the period between the two World Wars, the NAACP dominated the strategy of racial advancement. The NAACP drew Its strength from large numbers of Southern Negroes who had migrated to Northern cities; from a small but growing Negro group of professionals and businessmen who served them; from an upsurge of confidence among the "New Negro," race-proud and self-reliant, believing in racial cooperation and self-help and determined to fight for his constitutional rights; from writers and artists known as the "Harlem Renaissance" who used their own cultural tradition and experience as materials for their works. W.E.B. Du Bois, editor of the Crisis, the NAACP publication, symbolized the new mood and exerted great influence.

The NAACP did extraordinary service, giving legal defense to victims of race riots and unjust judicial proceedings. It obtained the release of the soldiers who had received life sentences on charges of rioting against intolerable conditions at Houston in 1917. It successfully defended Negro sharecroppers in Elaine, Arkansas, who in 1919 had banded together to gain fairer treatment, who had become the objects of a massive armed hunt by whites to put them "in their place," and who were charged with insurrection when they resisted. It secured the acquittal, with the help of Clarence Darrow, of Dr. Ossian Sweet and his family who had moved into a white neighborhood in Detroit, shot at a mob attacking their home, killed a man, and were eventually judged to have committed the act in self-defense.

The NAACP tried vainly to promote passage of an anti-lynching bill, but its most important activity was its campaign to secure enforcement of the 14th and 15th Amendments. It conducted sustained litigation against disfranchisement and segregation, and embarked upon a long fight against the white primaries in the Southern states. The NAACP attacked one aspect of discrimination at a time, hacking away at the structure of discrimination. Local branches in Northern and border cities won a number of important victories, but full recognition of the Negroes' constitutional rights was still a future prospect.

Less successful were attempts to prevent school segregation in Northern cities, which followed the migration of large numbers of rural black folk from the South. Gerrymandering of school boundaries and other devices by boards of education were fought with written petitions, verbal protests to school officials, legal suits and, in several cities, school boycotts. AU proved of no avail.

The thrust of the NAACP was primarily political and legal, but the National Urban League, founded in 1911 by philanthropists and social workers, sought an economic solution to the Negroes' problems. Sympathetic with Booker T. Washington's point of view, believing in conciliation, gradualism, and moral suasion, the Urban League searched out industrial opportunities for Negro migrants to the cities, using arguments that appealed to the white businessman's sense of economic self-interest and also to his conscience.

Also espousing an economic program to ameliorate the Negroes' condition was A. Philip Randolph, an editor of the Messenger. He regarded the NAACP as a middle-class organization unconcerned about pressing economic problems. Taking a Marxist position on the causes of prejudice and discrimination, Randolph called for a new and radical Negro unafraid to demand his rights as a member of the working class. He advocated physical resistance to white mobs, but he believed that only united action of black and white workers against capitalists would achieve social justice.

Although Randolph addressed himself to the urban working masses, few of them ever read the Messenger. The one man who reached the masses of frustrated and disillusioned migrants in the Northern ghettos was Marcus Garvey.

SEPARATISM

Garvey, founder in 1914 of the Universal Negro Improvement Association (UNIA), aimed to liberate both Africans and American Negroes from their oppressors. His utopian method was the wholesale migration of American Negroes to Africa. Contending that whites would always be racist, he stressed racial pride and history, denounced integration, and insisted that the black man develop "a distinct racial type of civilization of his own and ... work out his salvation in his motherland." On a more practical level he urged support of Negro businesses, and through the UNIA organized a chain of groceries, restaurants, laundries, a hotel, printing plant, and steamship line. When several prominent Negroes called the attention of the United States Government to irregularities in the management of the steamship line, Garvey was jailed, then deported for having used the mails to defraud.

But Garvey dramatized, as no one before, the bitterness and alienation of the Negro slum dwellers who, having come North with great expectations, found only overcrowded and deteriorated housing, mass unemployment, and race riots.
admin
Site Admin
 
Posts: 36230
Joined: Thu Aug 01, 2013 5:21 am

Re: Report of the National Advisory (Kerner Report 1967)

Postby admin » Mon May 02, 2016 11:11 am

Part 2 of 2

THE DEPRESSION

Negro labor, relatively unorganized and the target of discrimination and hostility, was hardly prepared for the depression. of the 1930's.To a disproportionate extent, Negroes lost their Jobs in cities and worked for starvation wages in rural areas. Although organizations like the National Urban League tried to improve employment opportunities, 65 percent of Negro employables were in need of public assistance by 1935.

Public assistance was given on a discriminatory basis, especially in the South. For a time Dallas and Houston gave no relief at all to Negro families. In general, Negroes had more difficulty than whites in obtaining assistance, and the relief benefits were smaller. Some religious and charitable organizations excluded Negroes from their soup kitchens.

THE NEW DEAL

The New Deal marked a turning point in American race relations. Negroes found much in the New Deal to complain about: discrimination existed in many agencies; federal housing programs expanded urban ghettos; money from the Agricultural Adjustment Administration went in the South chiefly to white landowners, while crop restrictions forced many Negro sharecroppers off the land. Nevertheless, Negroes shared in relief, jobs, and public housing, and Negro leaders, who felt the open sympathy of many highly placed New Dealers, held more prominent political positions than at any time since President Taft's administration. The creation of the Congress of Industrial Organizations (CIO), with its avowed philosophy of non-discrimination, made the notion of an alliance of black and white workers something more than a visionary's dream.

The depression, the New Deal, and the CIO reoriented Negro protest to concern with economic problems. Negroes conducted "Don't Buy Where You Can't Work" campaigns in a number of cities, boycotted and picketed commercial establishments owned by whites, and sought equality in American society through an alliance with white labor.

The NAACP came under attack from Negroes. Du Bois resigned as editor of the Crisis in 1934 because, believing in the value of collective racial economic endeavor, he saw little point in protesting disfranchisement and segregation without pursuing economic goals. Younger critics also disagreed with NAACP's gradualism on economic issues.

Undeterred, the NAACP broadened the scope of its legal work, fought a vigorous though unsuccessful campaign to abolish the poll tax, and finally won its attack on the white primaries in 1944 through the Supreme Court. But the heart of its litigation was a long-range campaign against segregation and the most obvious inequities in the Southern school systems: the lack of professional and graduate schools and the low salaries received by Negro teachers. Not until about 1950 would the NAACP make a direct assault against school segregation on the legal ground that separate facilities were inherently unequal.

WORLD WAR II

During World War II, Negroes learned again that fighting for their country brought them no nearer to full citizenship. Rejected when they tried to enlist, they were accepted into the Army according to the proportion of the Negro population to that of the country as a whole -- but only in separate units -- and those mostly noncombat. The United States thus fought racism in Europe with a segregated fighting force. In some instances at home, Negro soldiers were unable to secure food, even though German prisoners of war were being served. The Red Cross, with the government's approval, separated Negro and white blood in banks established for wounded servicemen -- even though the blood banks were largely the work of a Negro physician, Charles Drew.

Not until 1949 would the Armed Forces begin to adopt a firm policy against segregation.

Negroes seeking employment in defense industries were embittered by policies like that of a West Coast aviation factory which declared openly that "the Negro will be considered only as janitors and in other similar capacities.... Regardless of their training as aircraft workers, we will not employ them."

Two new movements marked Negro protest: the March on Washington, and the Congress of Racial Equality (CORE). In 1941, consciously drawing on the power of the Negro vote and concerned with the economic problems of the urban slum-dweller, A. Philip Randolph threatened a mass Negro convergence on Washington unless President Roosevelt secured employment for Negroes in the defense industries. The President's Executive Order 8802 establishing a federal Fair Ernployment Practices Commission forestalled the demonstration. Even without enforcement powers, the FEPC set a precedent for treating fair employment practice as a civil right.

CORE, founded in 1942-43, grew out of the Fellowship of Reconciliation, a pacifist organization, when certain leaders became interested in the use of nonviolent direct action to fight racial discrimination. CORE combined Gandhi's techniques with the sit-in, derived from the sit-down strikes of the 1930's. Until about 1959, CORE's main activity was attacking discrimination in places of public accommodation in the cities of the Northern and Border states, and as late as 1961, two-thirds of its membership and most of its national officers were white.

Meanwhile, racial disorders had broken out sporadically -- in Mobile, Los Angeles, Beaumont, Texas, and elsewhere. The riot in Detroit in 1943 was the most destructive. The Negro population in the city had risen sharply and more than 50,000 recent arrivals put immense pressures on the housing market. Neighborhood turnover at the edge of the ghetto bred bitterness and sometimes violence, and recreational areas became centers of racial abrasion. The federal regulations requiring employment standards in defense industries also angered whites, and several unauthorized walk-outs had occurred in automobile plants after Negro workers were upgraded. Activities in the city of several leading spokesmen for white supremacy -- Gerald L. K. Smith, Frank J. Norris, and Father Charles Coughlin -- inflamed many white southerners who migrated to Detroit during the war.

On Sunday, June 20, rioting broke out on Belle Isle, a recreational spot used by both races, but predominantly by Negroes. Fist fights escalated into a major conflict. The first wave of looting and bloodshed began in the Negro ghetto "Paradise Valley" and later spread to other sections of the city. Whites began attacking Negroes as they emerged from the city's all-night movie theatres in the downtown area. White forays into Negro residential areas by car were met by sniping. By the time federal troops arrived to halt the racial conflict, 25 Negroes and nine whites were dead, property damage exceeded $2 million, and a legacy of fear and hate became part of the city.

In Harlem, New York, a riot erupted also in 1943, following the attempt of a white policeman to arrest a Negro woman defended by a Negro soldier. Negro rioters assaulted white passersby, overturned parked automobiles, tossed bricks and bottles at policemen, but the major emphasis was on destroying property, looting and burning stores. Six persons died, over 500 were injured, more than 100 were jailed.

THE POSTWAR PERIOD

White opinion in some quarters of America had begun to shift to a more sympathetic regard for Negroes during the New Deal, and the war had accelerated that movement. Thoughtful whites had been painfully aware of the contradiction in opposing Nazi racial philosophy with racially segregated military units. In the postwar years, American racial attitudes became more liberal as new nonwhite nations emerged in Asia and Africa and took increasing responsibilities in international councils.

Against this background, the growing size of the Northern Negro vote made civil rights a major issue in national elections and, ultimately, in 1957, led to the federal Civil Rights Commission, which had the power to investigate discriminatory conditions throughout the country and to recommend corrective measures to the President. Northern and Western states outlawed discrimination in employment, housing, and public accommodations, while the NAACP, in successive court victories, ended racially restrictive covenants in housing, segregation in interstate transportation, and discrimination in publicly- owned recreational facilities. The NAACP helped register voters, and in 1954, Brown v. Board of Education became the triumphant climax to the NAACP's campaign against educational segregation in the public schools of the South.

CORE, demonstrating in the Border States, its major focus on public accommodations, began experimenting with direct-action techniques to open employment opportunities. In 1947, in conjunction with the Fellowship of Reconciliation, CORE conducted a "Journey of Reconciliation" -- what would later be called a "Freedom Ride" -- in the states of the Upper South to test compliance with the Supreme Court decision outlawing segregation on interstate buses. The resistance met by riders in some areas, the sentencing of two to 30 days on a North Carolina road gang, dramatized the gap between American democratic theory and practice.

But what captured the imagination of the nation and of the Negro community in particular, and what was chiefly responsible for the growing use of direct-action techniques, was the Montgomery, Alabama, bus boycott of 1955-1956, which catapulted into national prominence the Reverend Martin Luther King, Jr. Like the founders of CORE, King held to a Gandhian belief in the principles of pacifism.

Even before a court decision obtained by NAACP attorneys in November 1956 desegregated the Montgomery buses, a similar movement had started in Tallahassee, Florida. Afterward another one developed in Birmingham, Alabama. In 1957, the Tuskegee Negroes undertook a three-year boycott of local merchants after the state legislature gerrymandered nearly all of the Negro voters outside of the town's boundaries. In response to a lawsuit filed by the NAACP, the Supreme Court ruled the Tuskegee gerrymander illegal.

These events were widely heralded. A "new negro" had emerged m the South -- militant, no longer fearful of white hoodlums or mobs, and ready to use his collective weight to achieve his ends. In this mood, King established the Southern Christian Leadership Conference in 1957 to coordinate direct- action activities in Southern cities.

Negro protest had now moved in a vigorous fashion into the South, and like similar activities in the North, it was concentrated in the urban ghettos.

THE PERSISTENCE OF DISCRIMINATION

Nonviolent direct action attained popularity not only because of the effectiveness of King's leadership but because the older techniques of legal and legislative action had had limited success. Impressive as the advances in the 15 years after World War II were, in spite of state laws and Supreme Court decisions, something was still clearly wrong. Negroes were disfranchised in most of the South, though in the 12 years following the outlawing of the white primary in 1944, the number of Negroes registered in Southern states had risen from about 250,000 to nearly a million and a quarter. Supreme Court decisions desegregating transportation facilities were still being largely ignored in the South. Discrimination in employment and housing continued, not only in the South but also in Northern states with model civil rights laws. The Negro unemployment rate steadily moved upward after 1954. The South reacted to the Supreme Court's decision on school desegregation by outlawing the NAACP, intimidating civil rights leaders, bringing "massive resistance" to the Court's decision, curtailing Negro voter registration, and forming White Citizens' Councils.

REVOLUTION OF RISING EXPECTATIONS

At the same time, Negro attitudes were changing. Negroes were gaining a new sense of self-respect and a new self-image as a result of the civil rights movement and their own advancement. King and others were demonstrating that nonviolent direct action could succeed in the South. New laws and court decisions and increasing support of white public opinion gave American Negroes a new confidence in the future. There occurred what has been described as a "revolution in expectations."

Negroes no longer felt that they had to accept the humiliations of second-class citizenship, which consequently appeared more intolerable than ever. Ironically, it was the very successes in the legislatures and the courts that, more perhaps than any other single factor, led to intensified Negro expectations and resulting dissatisfaction with the limitations of legal and legislative programs. Increasing Negro impatience accounted for the rising tempo of nonviolent direct action in the late 1950's, culminating in the student sit-ins of 1960 and the inauguration of what is popularly known as the "Civil Rights Revolution" or the "Negro Revolt."

Many believe that the Montgomery boycott ushered in this Negro Revolt, and its importance, by projecting the image of King and his techniques, is great. But the decisive break with traditional techniques came with the college student sit-ins that swept the South in the winter and spring of 1960. In dozens of communities in the Upper South, the Atlantic coastal states, and Texas, student demonstrations secured the desegregation of lunch counters in drug and variety stores. Arrests were numbered in the thousands, and brutality was evident in scores of communities. In the Deep South the campaign ended in failure, even in instances where hundreds had been arrested, as in Montgomery; Orangeburg, South Carolina; and Baton Rouge. But the youth had captured the imagination of the Negro community and to a remarkable extent of the whole nation.

STUDENT INVOLVEMENT

The Negro protest movement would never be the same again. The Southern college students shook the power structure of the Negro community, made direct action temporarily pre-eminent as a civil rights tactic, speeded up the process of social change in race relations, and ultimately turned the Negro protest organizations toward a deep concern with the economic and social problems of the masses.

Involved in this was a gradual shift in both tactics and goals: from legal to direct action, from middle and upper class to mass action, from attempts to guarantee the Negro's constitutional rights to efforts to secure economic policies giving him equality of opportunity in a changing society, from appeals to the sense of fair play of white Americans to demands based upon power in the black ghetto.

The successes of the student movement threatened existing Negro leadership and precipitated a spirited rivalry among civil rights organizations. The NAACP and SCLC associated themselves with the student movement. The organizing meeting of the Student Nonviolent Coordinating Committee (SNCC) at Raleigh, North Carolina, in April 1960 was called by Martin Luther King, but within a year the youth considered King too cautious and broke with him.

The NAACP now decided to make direct action a major part of Its strategy and organized and reactivated college and youth chapters in the Southern and Border states.

CORE, still unknown to the general public installed James Farmer as national director in January 1961, and that spring joined the front rank of civil rights organizations with the famous Freedom Ride to Alabama and Mississippi that dramatized the persistence of segregated public transportation. A bus-burning resulted in Alabama, and hundreds of demonstrators spent a month or more in Mississippi prisons. Finally, a new order from the Interstate Commerce Commission desegregating all interstate transportation facilities received partial compliance.

ORGANIZATIONAL RIVALRIES

Disagreement over strategy and tactics inevitably became intertwined with personal and organizational rivalries. Each civil rights group felt the need for proper credit in order to obtain the prestige and financial contributions necessary to maintain and expand its own programs. The local and national, individual and organizational clashes only stimulated competition and activity that further accelerated the pace of social change.

Yet there were differences in style. CORE was the most interracial. SCLC appeared to be the most deliberate. SNCC staff workers lived on subsistence allowances and seemed to regard going to jail as a way of life. The NAACP continued the most varied programs, retaining a strong emphasis on court litigation, maintaining a highly effective lobby at the national capital, and engaging in direct-action campaigns. The National Urban League, under the leadership of Whitney M. Young, Jr., appointed executive director in 1961, became more outspoken and talked more firmly to businessmen who had previously been treated with utmost tact and caution.

THE ROLE OF WHITES

The role of whites in the protest movement gradually changed. Instead of occupying positions of leadership, they found themselves relegated to the role of followers. Whites were likely to be suspect in the activist organizations. Negroes had come to feel less dependent on whites, more confident of their own power, and they demanded that their leaders be black. The NAACP had long since acquired Negro leadership but continued to welcome white liberal support. SCLC and SNCC were from the start Negro-led and Negro-dominated. CORE became predominantly Negro as it expanded in 1962 and 1963; today all executives are Negro, and a constitutional amendment adopted in 1965 officially limited white leadership in the chapters.

THE BLACK MUSLIMS

A major factor intensifying the civil rights movement was widespread Negro unemployment and poverty; an important force in awakening Negro protest was the meteoric rise to national prominence of the Black Muslims, established around 1930. The organization reached the peak of its influence when more progress toward equal rights was being made than ever before in American history while at the same time economic opportunity for the poorest groups in the urban ghettos was stagnating.

Increasing unemployment among Negroes, combined with the revolution in expectations, created a climate in which the Black Muslims thrived. They preached a vision of the doom of the white "devils" and the coming dominance of the black man, promised a utopian paradise of a separate territory within the United States for a Negro state, and offered a practical program of building Negro business through hard work, thrift, and racial unity. To those willing to submit to the rigid discipline of the movement, the Black Muslims organization gave a sense of purpose and dignity.

"FREEDOM NOW!"

As the direct-action tactics took more dramatic form, as the civil rights groups began to articulate the needs of the masses and draw some of them to their demonstrations, the protest movement in 1963 assumed a new note of urgency, a demand for complete "Freedom Now!" Direct action returned to the Northern cities, taking the form of massive protests against economic, housing and educational inequities, and a fresh wave of demonstrations swept the South from Cambridge, Maryland, to Birmingham, Alabama. Northern Negroes launched street demonstrations against discrimination in the building trade unions and, the following winter, school boycotts against de facto segregation.

In the North, 1963 and 1964 brought the beginning of the waves of civil disorders in Northern urban centers. In the South, incidents occurred of brutal white resistance to the civil rights movement, beginning with the murder of Mississippi Negro leader Medgar Evers and four Negro schoolgirls m a church m Birmingham. These disorders and the events in the South are detailed in the Introduction to Chapter 1 the Profiles of Disorder.

The massive anti-Negro actions in Birmingham and numerous other Southern cities during the spring of 1963, compelled the nation to face the problem of race prejudice in the South. President Kennedy affirmed that racial discrimination was a moral issue and asked Congress for a major civil rights bill. But a major impetus for what was to be the Civil Rights Act of 1964 was the March on Washington in August 1963.

Early in the year, A. Philip Randolph issued a call for a March on Washington to dramatize the need for jobs and to press for a federal commitment to job action. At about the same time, Protestant, Jewish, and Catholic churches sought and obtained representation on the March committee. Although the AFL-CIO national council refused to endorse the March, a number of labor leaders and international unions participated.

Reversing an earlier stand, President Kennedy approved the March. A quarter of a million people, about 20 percent of them white, participated. It was more than a summation of the past years of struggle and aspiration. It symbolized certain new directions: a deeper concern for the economic problems of the masses; more involvement of white moderates; and new demands from the most militant, who implied that only a revolutionary change in American institutions would permit Negroes to achieve the dignity of citizens.

President Kennedy had set the stage for the Civil Rights Act of 1964. After his death President Johnson took forceful and effective action to secure its enactment. The law settled the public accommodations issue in the South's major cities. Its voting section, however, promised more than it could accomplish. Martin Luther King and SCLC dramatized the issue locally with demonstrations at Selma, Alabama, in the spring of 1965. Again the national government was forced to intervene, and a new and more effective voting law was passed.

FAILURES OF DIRECT ACTION

Birmingham had made direct action respectable, but Selma, which drew thousands of white moderates from the North, made direct action fashionable. Yet as early as 1964, it was becoming evident that, like legal action, direct action was an instrument of limited usefulness. This was the result of two converging developments.

In deep South states like Mississippi and Alabama, direct action had failed to desegregate public accommodations in the sit-ins of 1960-1961. A major reason was that Negroes lacked the leverage of the vote. The demonstrations of the early 1960's had been successful principally in places like Atlanta, Nashville, Durham, Winston-Salem, Louisville, Savannah, New Orleans, Charleston, and Dallas -- where Negroes voted and could swing elections. Beginning in 1961 Robert Moses of SNCC, with the cooperation of CORE and NAACP, established voter registration projects in the cities and county . seats of Mississippi. He succeeded in registering only a handful of Negroes, but by 1964, he had generated enough support throughout the country to enable the Mississippi Freedom Democratic Party, which he had created, to challenge dramatically the seating of the official white delegates from the state at the Democratic National Convention.

In the black ghettos of the North direct action also largely failed. Street demonstrations did compel employers, from supermarkets to banks, to add many Negroes to their work force in Northern and Western cities, in some Southern cities, and even in some Southern towns where the Negroes had considerable buying power. However, separate and inferior schools, slum housing, and police hostility proved invulnerable to direct attack.

NEW DIRECTIONS

But while Negroes were being hired in increasing numbers, mass unemployment and underemployment remained. As economist Vivian Henderson pointed out in his testimony before the Commission:

No one can deny that all Negroes have benefited from civil rights laws and desegregation in public life in one way or another. The fact is, however, that the masses of Negroes have not experienced tangible benefits in a significant way. This is so in education and housing. It is critically so in the area of jobs and economic security. Expectations of Negro masses for equal job opportunity programs have fallen far short of fulfillment.

Negroes have made gains. . . . There have been important gains. But ... the masses of Negroes have been virtually un• touched by those gains.


Faced with the intransigence of the deep South and the inadequacy of direct action to solve the problems of the slum dwellers, Negro protest organizations began to diverge. The momentum toward unity, apparent in 1963, was lost. At the very time that white support for the protest movement was rising markedly, militant Negroes felt increasingly isolated from the American scene. On two things, however, all segments of the protest movement agreed: (1) future civil rights activity would have to focus on the economic and social discrimination in the urban ghettos and (2) while demonstrations would still have a place, the major weapon would have to be the political potential of the black masses.

By the middle of the decade, many militant Negro members of SNCC and CORE began to turn away from American society and the "middle-class way of life." Cynical about the liberals and the leaders of organized labor, they regarded compromise, even as a temporary tactical device, as anathema. They talked more of "revolutionary" changes in the social structure, of retaliatory violence, and increasingly rejected white assistance. They insisted that Negro power alone could compel the white "ruling class" to make concessions. Yet they also spoke of an alliance of Negroes and unorganized lowerc-lass whites to overthrow the "power structure" of capitalists, politicians and bureaucratic labor leaders who exploited the poor of both races by dividing them through an appeal to race prejudice.

At the same time that their activities declined, other issues, particularly Vietnam, diverted the attention of the country, including some Negro leaders, from the issue of equality. Reduced financing made it increasingly difficult to support staff personnel, even on a subsistence basis. Most important was the increasing frustration of expectations that affected the direct-action advocates of the early 1960's -- the sense of futility growing out of the feeling that progress had turned out to be "tokenism," that the compromises of the white community were sedatives rather than solutions and that the current methods of Negro protest were doing little for the masses of the race.

As frustration grew, the ideology and rhetoric of a number of civil rights activists became angrier. One man more than any other -- a black man who grew up believing whites had murdered his father -- became the spokesman for this anger: Malcolm X, who perhaps best embodied the belief that racism was so deeply ingrained in white America that appeals to conscience would bring no fundamental change.

"BLACK POWER"

In this setting the rhetoric of "Black Power" developed. The precipitating occasion was the Meredith March from Memphis to Jackson in June 1966, but the slogan expressed tendencies that had been present for a long time and had been gaining strength in the Negro community.

Black Power first articulated a mood rather than a program -- disillusionment and alienation from white America and independence, race pride, and self-respect, or "black consciousness." Having become a household phrase, the term generated intense discussion of its real meaning, and a broad spectrum of ideologies and programmatic proposals emerged.

In politics, Black Power meant independent action -- Negro control of the political power of the black ghettos and its conscious use to better slum dwellers' conditions. It could take the form of organizing a black political party or controlling the political machinery within the ghetto without the guidance or support of white politicians. Where predominantly Negro areas lacked Negroes in elective office, whether in the rural Black Belt of the South or in the urban centers, Black Power advocates sought the election of Negroes by voter registration campaigns, by getting out the vote, and by working for redrawing electoral districts. The basic belief was that only a well-organized and cohesive bloc of Negro voters could provide for the needs of the black masses. Even some Negro politicians allied to the major political parties adopted the term "Black Power" to describe their interest in the Negro vote.

In economic terms, Black Power meant creating independent, self-sufficient Negro business enterprise, not only by encouraging Negro entrepreneurs but also by forming Negro cooperatives in the ghettos and in the predominantly black rural counties of the South. In the area of education, Black Power called for local community control of the public schools in the black ghettos.

Throughout, the emphasis was on self-help, racial unity, and, among the most militant, retaliatory violence, the latter ranging from the legal right of self-defense to attempts to justify looting and arson in ghetto riots, guerrilla warfare and armed rebellion.

Phrases like "Black Power," "Black Consciousness," and "Black is Beautiful," enjoyed an extensive currency in the Negro community, even within the NAACP and among relatively conservative politicians, but particularly among young intellectuals and Afro-American student groups on predominantly white college campuses. Expressed in its most extreme form by small, often local, fringe groups, the Black Power ideology became associated with SNCC and CORE.

Generally regarded as the most militant among the important Negro protest organizations, they have different interpretations of the Black Power doctrine. SNCC calls for totally independent political action outside the established political parties, as with the Black Panther Party in Lowndes County, Alabama; questions the value of political alliances with other groups until Negroes have themselves built a substantial base of independent political power; applauds the idea of guerrilla warfare; and regards riots as rebellions.

CORE has been more flexible. Approving the SNCC strategy, it also advocates working within the Democratic Party; forming alliances with other groups and, while seeking to justify riots as the natural explosion of an oppressed people against intolerable conditions, advocates violence only in self-defense. Both groups favor cooperatives, but CORE has seemed more inclined toward job-training programs and developing a Negro entrepreneurial class, based upon the market within the black ghettos.

OLD WINE IN NEW BOTTLES

What is new about "Black Power" is phraseology rather than substance. Black consciousness has roots in the organization of Negro churches and mutual benefit societies in the early days of the republic, the antebellum Negro convention movement, the Negro colonization schemes of the 19th century, Du Bois' concept of Pan-Africanism, Booker T. Washington's advocacy of race pride, self-help, and racial solidarity, the Harlem Renaissance, and the Garvey movement. The decade after World War I -- which saw the militant, race-proud "new negro," the relatively widespread theory of retaliatory violence, and the high tide of the Negro-support-of-Negro-business ideology -- exhibits striking parallels with the 1960's.

Similarly, there are striking parallels between both of these periods and the late 1840's and 1850's when ideologies of self-help, racial solidarity, separatism and nationalism, and the advocacy of organized rebellion were widespread.

The theme of retaliatory violence is hardly new for American Negroes. Most racial disorders in American history until recent years, were characterized by white attacks on Negroes. But Negroes retaliated violently during Reconstruction, just after World War I, and in the last four years.

Black Power rhetoric and ideology actually express a lack of power. The slogan emerged when the Negro protest movement was slowing down, when it was finding increasing resistance to its changing goals, when it discovered that nonviolent direct action was no more a panacea than legal action, when CORE and SNCC were declining in terms of activity, membership, and financial support. This combination of circumstances provoked anger deepened by impotence. Powerless to make any fundamental changes in the life of the rnasses -- powerless, that is, to compel white America to make those changes -- many advocates of Black Power have retreated into an unreal world, where they see an outnumbered and poverty- stricken minority organwng itself independently of whites and creating sufficient power to force white America to grant its demands. To date, the evidence suggests that the situation is much like that of the 1840's, when a small group of intellectuals advocated slave insurrections, but stopped short of organizing them.

The Black Power advocates of today consciously feel that they are the most militant group in the Negro protest movement. Yet they have retreated from a direct confrontation with American society on the issue of integration and, by preaching separatism, unconsciously function as an accommodation to white racism. Much of their economic program, as well as their interest in Negro history, self-help, racial solidarity and separation, is reminiscent of Booker T. Washington. The rhetoric is different, but the programs are remarkably similar.

THE MEANING

By 1967, whites could point to the demise of slavery, the decline of illiteracy among Negroes, the legal protection provided by the constitutional amendments and civil rights legislation, and the growing size of the Negro middle class. Whites would call it Negro progress from slavery to freedom toward equality.

Negroes could point to the doctrine of white supremacy, its widespread acceptance, its persistence after emancipation, and its influence on the definition of the place of Negroes in American life. They could point to their long fight for full citizenship, when they had active opposition from most of the white population and little or no support from the government. They could see progress toward equality accompanied by bitter resistance. Perhaps most of all, they could feel the persistent, pervasive racism that kept them in inferior segregated schools, restricted them to ghettos, barred them from fair employment, provided double standards in courts of justice, inflicted bodily harm on their children, and blighted their lives with a sense of hopelessness and despair.

In all of this and in the context of professed ideals, Negroes would find more retrogression than progress, more rejection than acceptance.

Until the middle of the 20th century, the course of Negro protest movements in the United States except for slave revolts, was based in the cities of the North, where Negroes enjoyed sufficient freedom to mount a sustained protest. It was in the cities, North and South, that Negroes had their greatest independence and mobility. It was natural, therefore, for black protest movements to be urban-based -- and, until the last dozen years or so, limited to the North. As Negroes migrated from the South, the mounting strength of their votes in Northern cities became a vital element in drawing the federal government into the defense of the civil rights of Southern Negroes. White rural Negroes today face great racial problems, the major unsolved questions that touch the core of Negro life stem from discrimination embedded in urban housing, employment, and education.

Over the years the character of Negro protest has changed. Originally it was a white liberal and Negro upper class movement aimed at securing the constitutional rights of Negroes through propaganda, lawsuits, and legislation. In recent years the emphasis in tactics shifted first to direct action and then -- among the most militant -- to the rhetoric of "Black Power." The role of white liberals declined as Negroes came to direct the struggle. At the same time the Negro protest movement became more of a mass movement, with increasing participation from the working classes. As these changes were occurring, and while substantial progress was being made to secure constitutional rights for the Negroes, the goals of the movement were broadened. Protest groups now demand special efforts to overcome the Negro's poverty and cultural deprivation -- conditions that cannot be erased simply by ensuring constitutional rights.

The central thrust of Negro protest in the current period has aimed at the inclusion of Negroes in American society on a basis of full equality rather than at a fundamental transformation of American institutions. There have been elements calling for a revolutionary overthrow of the American social system or for a complete withdrawal of Negroes from American society. But these solutions have had little popular support. Negro protest, for the most part, has been firmly rooted in the basic values of American society, seeking not their destruction but their fu1fillment.
admin
Site Admin
 
Posts: 36230
Joined: Thu Aug 01, 2013 5:21 am

Re: Report of the National Advisory (Kerner Report 1967)

Postby admin » Mon May 02, 2016 11:46 pm

Chapter 6: The Formation of the Racial Ghettos MAJOR TRENDS IN NEGRO POPULATION

Throughout the 20th century, and particularly in the last three decades, the Negro population of the United States has been steadily moving from rural areas to urban, from South to North and West.

In 1910, 2.6 million Negroes lived in American cities -- 27 percent of the nation's Negro population of 9.8 million. Today, about 15 million Negro Americans live in metropolitan areas, or 69 percent of the Negro population of 21.5 million. In 1910,800,000 Negroes -- 9 percent -- lived outside the South. Now, almost 10 million, about 45 percent, live in the North or West.

These shifts in population have resulted from three basic trends:

• A rapid increase in the size of the Negro population.
• A continuous flow of Negroes from Southern rural areas, partly to large cities in the South, but primarily to large cities m the North and West.
• An increasing concentration of those Negroes in large metropolitan areas within racially segregated neighborhoods.

Taken together, these trends have produced large and constantly growing concentrations of Negro population within big cities in all parts of the nation. Because most major civil disorders of recent years occurred in all-Negro neighborhoods, we have examined the causes of this concentration.

THE GROWTH RATE OF THE NEGRO POPULATION

During the first half of this century, the white population of the United States grew at a slightly faster rate than the Negro population. Because fertility rates [1] among Negro women were more than offset by death rates among Negroes and by large-scale immigration of whites from Europe, the proportion of Negroes in the country declined from 12 percent in 1900 to 10 percent in 1940.

By the end of World War II -- and increasingly since then -- major advances in medicine and medical care, together with the increasing youth of the Negro population resulting from higher fertility rates, caused death rates among Negroes to fall much faster than among whites. This is shown in the following table:

Death Rate/1,000 Population

Image

In addition, white immigration from outside the United States dropped dramatically after stringent restrictions were adopted in the 1920's.

Twenty-Year Period / Total Immigration (millions)

Image

Thus, by mid-century, both factors which previously had offset higher fertility rates among Negro women no longer were in effect.

While Negro fertility rates, after rising rapidly to 1957, have declined sharply in the past decade, white fertility rates have dropped even more, leaving Negro rates much higher in comparison.

Live Births Per 1,000 Women

Image

The result is that Negro population is now growing significantly faster than white population. From 1940 to 1960, the white population rose 34.0 percent, but the Negro population rose 46.6 percent. From 1960 to 1966, the white population grew 7.4 percent; whereas Negro population jumped 14.4 percent, almost twice as much.

Consequently, the proportion of Negroes in the total population has risen from 10.0 percent in 1950 to 10.5 percent in 1960, and 11.1 percent in 1966. [2]

In 1950, at least one of every ten Americans was Negro; in 1966, one of nine. If this trend continues, one of every eight Americans will be Negro by 1972.

Another consequence of higher birth rates among Negroes is that the Negro population is considerably younger than the white population. In 1966, the median age among whites was 29.1 years, as compared to 21.1 among Negroes. About 35 percent of the white population was under 18 years of age, compared with 45 percent for Negroes. About one of every six children under five and one of every six new babies are Negro.

Negro-white fertility rates bear an interesting relationship to educational experience. Negro women with low levels of education have more children than white women with similar schooling, while Negro women with four years or more of college education have fewer children than white women similarly educated. The following table illustrates this:
Number of Children Ever Born to All Woman (Married or Unmarried)

This suggests that the difference between Negro and white fertility rates may decline in the future if Negro educational attainment compares more closely with that of whites, and if a rising proportion of members of both groups complete college.

THE MIGRATION OF NEGROES FROM THE SOUTH

The Magnitude of This Migration


Image

In 1910, 91 percent of the nation's 9.8 million Negroes lived in the South. Twenty-seven percent of American Negroes lived in cities of 2,500 persons or more, as compared to 48 percent of the nation's white population.

By 1966, the Negro population had increased to 21.5 million, and two significant geographic shifts had taken place. The proportion of Negroes living in the South had dropped to 55 percent and about 69 percent of all Negroes lived in metropolitan areas compared to 64 percent for whites. While the total Negro population more than doubled from 1910 to 1966, the number living in cities rose five-fold (from 2.6 million to 14.8 million) and the number outside the South rose eleven-fold (from 880,000 to 9.7 million).

Negro migration from the South began after the Civil War. By the turn of the century, sizeable Negro populations lived in many large Northern cities -- Philadelphia, for example, had 63,400 Negro residents in 1900. The movement of Negroes out of the rural South accelerated during World War I, when floods and boll weevils hurt farming in the South, and the industrial demands of the war created thousands of new jobs for unskilled workers in the North. After the war, the shift to mechanized farming spurred the continuing movement of Negroes from rural Southern areas.

The Depression slowed this migratory flow, but World War II set it in motion again. More recently, continuing mechanization of agriculture and the expansion of industrial employment in Northern and Western cities have served to sustain the movement of Negroes out of the South, although at a slightly lower rate.

Net Negro Out-migration from the South  

Image

From 1960 to 1963, annual Negro out-migration actually dropped to 78,000 but then rose to over 125,000 from 1963 to 1966.

Important Characteristics of this Migration

It is useful to recall that even the latest scale of Negro migration is relatively small when compared to the earlier waves of European immigrants. A total of 8.8 million immigrants entered the United States between 1901 and 1911, and another S.7 million arrived during the following decade. Even during the years from 1960 through 1966, the 1.8 million immigrants from abroad vastly outnumbered the 613,000 Negroes who departed the South. In these same six years, California alone gained over 1.5 million new residents from internal shifts of American population.

Three major routes of Negro migration from the South have developed. One runs north along the Atlantic Seaboard toward Boston, another north from Mississippi toward Chicago, and the third west from Texas and Louisiana toward California. Between 1955 and 1960, 50 percent of the nonwhite migrants to the New York metropolitan area came from North Carolina, South Carolina, Virginia, Georgia, and Alabama; North Carolina alone supplied 20 percent of all New York's nonwhite immigrants. During the same period; almost 60 percent of the nonwhite migrants to Chicago came from Mississippi, Tennessee, Arkansas, Alabama, and Louisiana; Mississippi accounted for almost one-third. During these years, three-fourths of the nonwhite migrants to Los Angeles came from Texas, Louisiana, Mississippi, Arkansas, and Alabama. The flow of Negroes from the South has caused the Negro population to grow more rapidly in the North and West, as indicated below.

Total Negro Population Gains (Millions)

Image

As a result, although a much higher proportion of Negroes still reside in the South, the distribution of Negroes throughout the United States is beginning to approximate that of whites, as the following tables show.
Percent Distribution of the Population By Region -- 1950, 1960 and 1966

Negroes as a Percentage of the Total Population in the United States and Each Region 1950, 1960, and 1966

Image

Negroes in the North and West are now so numerous that natural increase rather than migration provides the greater part of Negro population gains there. And even though Negro migration has risen steadily, it comprises a constantly declining proportion of Negro growth in these regions.

Percentage of Total North & West Negro Gain From Southern In-migration

Image

In other words, we have reached the point where the Negro populations of the North and West will continue to expand significantly even if migration from the South drops substantially.

Future Migration

Despite accelerating Negro migration from the South, the Negro population there has continued to rise.

Negro Population in the South (millions)

Image

Nor is it likely to halt. Negro birth rates in the South, as elsewhere, have fallen sharply since 1957, but so far, this decline has been offset by the rising Negro population base remaining in the South. From 1950 to 1960, Southern Negro births generated an average net increase of 254,000 per year, and from 1960 to 1966, an almost identical 188,000 per year. Even if Negro birth rates continue to fall, they are likely to remain high enough to support significant migration to other regions for some time to come.

The Negro population in the South is becoming increasingly urbanized. In 1950, there were 5.4 million Southern rural Negroes; by 1960, 4.8 million. But this decline has been more than offset by increases in the urban population. A rising proportion of inter-regional migration now consists of persons moving from one city to another. From 1960 to 1966, rural Negro population in the South was far below its peak, but the annual average migration of Negroes from the South was still substantial.

These facts demonstrate that Negro migration from the South, which has moved at an accelerating rate for the past 60 years, will continue, unless economic conditions change dramatically in either the South or the North and West. This conclusion is reinforced by the fact that most Southern states in recent decades have also experienced outflows of white population. From 1950 to 1960, 12 of the 17 Southern states (including the District of Columbia) "exported" white population -- as compared to 13 which "exported" Negro population. Excluding Florida's net gain by migration of 1.5 million, the other 16 Southern states together had a net loss by migration of 1.46 million whites.

THE CONCENTRATION OF NEGRO POPULATION IN LARGE CITIES

Where Negro Urbanization Has Occurred


Statistically, the Negro population in America has become more urbanized, and more metropolitan, than the white population. According to Census Bureau estimates, almost 70 percent of all Negroes in 1966. lived in metropolitan areas, compared to 64 percent of all whites. In the South, more than half the Negro population now lives in cities. Rural Negroes outnumber urban Negroes in only four states: Arkansas, Mississippi, North Carolina, and South Carolina.

Basic data concerning Negro urbanization trends, presented in tables at the conclusion of this chapter, indicate that:

• Almost all Negro population growth is occurring within metropolitan areas, primarily within central cities. From 1950 to 1966, the U. S. Negro population rose 6.5 million. Over 98 percent of that increase took place in metropolitan areas -- 86 percent within central cities, 12 percent in the urban fringe.

• The vast majority of white population growth is occurring in suburban portions of metropolitan areas. From 1950 to 1966, 77.8 percent of the white population increase of 35.6 million took place in the suburbs. Central cities received only 2.5 percent of this total white increase. Since 1960, white central-city population has actually declined by 1.3 million.

• As a result, central cities are steadily becoming more heavily Negro, while the urban fringes around them remain almost entirely white. The proportion of Negroes in all central cities rose steadily from 12 percent in 1950, to 17 percent in 1960, to 20 percent in 1966. Meanwhile, metropolitan areas outside of central cities remained 95 percent white from 1950 to 1960, and became 96 percent white by 1966.

• The Negro population is growing faster, both absolutely and relatively, in the larger metropolitan areas than in the smaller ones. From 1950 to 1966, the proportion of nonwhites in the central cities of metropolitan areas with one million or more persons doubled, reaching 26 percent, as compared with 20 percent in the central cities of metropolitan areas containing from 250,000 to one million persons, and 12 percent in the central cities of metropolitan areas containing under 250,000 persons.

• The 12 largest central cities (New York, Chicago, Los Angeles, Philadelphia, Detroit, Baltimore, Houston, Cleveland, Washington, D. C., St. Louis, Milwaukee, and San Francisco) now contain over two-thirds of the Negro population outside the South, and one-third of the Negro total in the United States. All these cities have experienced rapid increases in Negro population since 1950. In six (Chicago, Detroit, Cleveland, St. Louis, Milwaukee, and San Francisco), the proportion of Negroes at least doubled. In two others (New York and Los Angeles), it probably doubled. In 1968, seven of these cities are over 30 percent Negro, and one (Washington, D. C.) is two-thirds Negro.

Factors Causing Residential Segregation in Metropolitan Areas

The early pattern of Negro settlement within each metropolitan area followed that of immigrant groups. Migrants converged on the older sections of the central city because the lowest cost housing was there, friends and relatives were likely to be there; and the older neighborhoods then often had good public transportation.

But the later phases of Negro settlement and expansion in metropolitan areas diverge sharply from those typical of white immigrants. As the whites were absorbed by the larger society, many left their predominantly ethnic neighborhoods and moved to outlying areas to obtain newer housing and better schools. Some scattered randomly over the suburban area. Others established new ethnic clusters in the suburbs, but even these rarely contained solely members of a single ethnic group. As a result, most middle-class neighborhoods -- both in the suburbs and within central cities -- have no distinctive ethnic character, except that they are white.

Nowhere has the expansion of America's urban Negro population followed this pattern of dispersal. Thousands of Negro families have attained incomes, living standards, and cultural levels matching or surpassing those of whites who have "upgraded" themselves from distinctly ethnic neighborhoods. Yet most Negro families have remained within predominantly Negro neighborhoods, primarily because they have been effectively excluded from white residential areas.

Their exclusion has been accomplished through various discriminatory .practices, some obvious and overt, others subtle and hidden. Deliberate efforts are sometimes made to discourage Negro families from purchasing or renting homes in all- white neighborhoods. Intimidation and threats of violence have ranged from throwing garbage on lawns and making threatening phone calls to burning crosses in yards and even dynamiting property. More often, real estate agents simply refuse to show homes to Negro buyers.

Many middle-class Negro families, therefore, cease looking for homes beyond all-Negro areas or nearby "changing" neighborhoods. For them, trying to move into all-white neighborhoods is not worth the psychological efforts and costs required.

Another form of discrimination just as significant is "white flight" -- withdrawal from, or refusal to enter neighborhoods where large numbers of Negroes are moving or already residing. Normal population turnover causes about 20 percent of the residents of average United States neighborhoods to move out every year because of income changes, job transfers, shifts in life-cycle position or deaths. This normal turnover rate is even higher in apartment areas. The refusal of whites to move into "changing" areas when vacancies occur there from normal turnover means that most vacancies are eventually occupied by Negroes. An inexorable shift toward heavy Negro occupancy results.

Once this happens, the remaining whites seek to leave, and this seems to confirm the existing belief among whites that complete transformation of a neighborhood is inevitable once Negroes begin to enter. Since the belief itself is one of the major causes of the transformation, it becomes a self-fulfilling prophecy, which inhibits the development of racially integrated neighborhoods.

Thus, Negro settlements expand almost entirely through "massive racial transition" at the edges of existing all-Negro neighborhoods, rather than by a gradual dispersion of population throughout the metropolitan area.

Two important points to note about this phenomenon are that:

• "Massive transition" requires no panic or flight by the original white residents of a neighborhood into which Negroes begin moving. All it requires is the failure or refusal of other whites to fill the vacancies resulting from normal turnover.

• Thus, efforts to stop massive transition by persuading present white residents to remain will ultimately fail unless whites outside the neighborhood can be persuaded to move in.

Some residential separation of whites and Negroes would occur even without discriminatory practices by whites. Separation would result from the desires of some Negroes to live in predominantly Negro neighborhoods like many other groups, and from differences in meaningful social variables, such as income and educational levels, between many Negroes and many whites. But these factors would not lead to the almost complete segregation of whites and Negroes, which has developed in our metropolitan areas.

The Exodus of Whites from Central Cities

The process of racial transition in central-city neighborhoods has been only one factor among many others causing millions of whites to move out of central cities as the Negro populations there expanded. More basic perhaps have been the rising mobility and affluence of middle-class families and the more attractive living conditions -- particularly better schools- -- n the suburbs.

Whatever the reason, the result is clear. In 1950, 45.5 million whites lived in central cities. If this population had grown from 1950 to 1960 at. the same rate as the nation's white population as a whole, it would have increased by eight million. It actually rose only 2.2 million, indicating an outflow of 5.8 million. [4]

From 1960 to 1966, the white outflow appears to have been even more rapid. White population of central cities declined 1.3 million instead of rising 3.6 million as it would if it had grown at the same rate as the entire white population. In theory, therefore, 4.9 million whites left central cities during these six years.

Statistics for all central cities as a group understate the relationship between Negro population growth and white outflow in individual central cities. The fact is, many cities with relatively few Negroes experienced rapid white-population growth, thereby obscuring the size of white out-migration that took place out of cities having big increases in Negro population. For example, from 1950 to 1960, the 10 largest cities in the United States had a total Negro population increase of 1.8 million, or 58 percent, while the white population there declined 1.5 million. If we remove the two cities where the white population increased (Los Angeles and Houston), the nonwhite population in the remaining eight rose 1.4 million; whereas their white population declined 2.1 million. If the white population in these cities had increased at only half the rate of the white population in the United States as a whole from 1950 to 1960, it would have risen by 1.4 million. Thus, these eight cities actually experienced a white out-migration of at least 3.5 million, while gaining 1.4 million nonwhites.

The Extent of Residential Segregation

The rapid expansion of all-Negro residential areas in central cities and large-scale white withdrawal from them have continued a pattern of residential segregation that has existed in American cities for decades. A recent study [5] reveals that this pattern is present to a high degree in every large city in America. The authors devised an index to measure the degree of residential segregation. The index indicates for each city the percentage of Negroes who would have to move from the blocks where they now live to other blocks in order to provide a perfectly proportional, unsegregated distribution of population.

According to their findings, the average segregation index for 207 of the largest United States cities was 86.2 in 1960. This means that an average of over 86 percent of all Negroes would have had to change blocks to create an unsegregated population distribution. Southern cities had a higher average index (90.9) than cities in the Northeast (79.2), the North Central (87.7), or the West (79.3). Only eight cities had index values below 70, whereas over 50 had values above 91.7.

The degrees of residential segregation for all 207 cities has been relatively stable, averaging 85.2 in 1940, 87.3 in 1950, and 86.2 in 1960. Variations within individual regions were only slightly larger. However, a recent Census Bureau study shows that in most of the 12 large cities where special censuses were taken in the mid-1960's, the proportions of Negroes living in neighborhoods of greatest Negro concentration had increased since 1960.

Residential segregation is generally more prevalent with respect to Negroes than for any other minority group, including Puerto Ricans, Orientals, and Mexican Americans. Moreover, it varies little between central city and suburb. This nearly universal pattern cannot be explained in terms of economic discrimination against all low-income groups. Analysis of 15 representative cities indicates that white upper- and middle- income households are far more segregated from Negro upper- and middle-income households than from white lower-income households.

In summary, the concentration of Negroes in central cities results from a combination of forces. Some of these forces, such as migration and initial settlement patterns in older neighborhoods, are similar to those which affected previous ethnic minorities. Others -- particularly discrimination in employment and segregation in housing and schools -- are a result of white attitudes based on race and color. These forces continue to shape the future of the central city.

Proportion of Negroes in Each of the 30 Largest Cities, 1950, 1960, and Estimated 1965

Image
* Except for Cleveland, Buffalo, Memphis, and Phoenix, for which a special census has been made in recent years, these are very rough estimations computed on the basis of the change in relative proportions of Negro births and deaths since 1960.
Source: U. S. Department of Commerce, Bureau of the Census.


Percent of All Negroes in Selected Cities Living in Census Tracts Grouped According to Proportion Negro in 1960 and 1964-1966 [7]

Image

Population Change by Location, Inside and Outside Metropolitan Areas, 1950-1966 (numbers in millions)

Image

Change, 1950-1966

Image

Percent Distribution of Population by Location, Inside and Outside Metropolitan Areas, 1950, 1960 and 1966

Image

Negroes as a Percentage of Total Population by Location, Inside and Outside Metropolitan Areas, and by Size of Metropolitan Areas -- 1950, 1960 and 1966

Image

_______________

Notes:

1. The "fertility rate" is the number of live births per year per 1,000 women age 15 to 44 in the group concerned.

2.  These proportions are undoubtedly too low because the Census Bureau bas consistently undercounted the number of Negroes in the U. S. by as much as 10 percent.

3. Rounds to 99.

4. The outflow of whites may be somewhat smaller than the 5.8 million difference between these figures. because the ages of the whites in many central cities are higher than in the nation as a whole, and therefore the population would have grown somewhat more slowly.

5. Negroes In Cities, Karl and Alma Taeuber, Aldine Publishing Co., Chicago (1965).
admin
Site Admin
 
Posts: 36230
Joined: Thu Aug 01, 2013 5:21 am

PreviousNext

Return to Slavery 2.0: Racist Cops and the Prison Industrial Complex

Who is online

Users browsing this forum: No registered users and 2 guests