Appendix A: Estimating Length of Stay by State
DataThis study relies primarily on data from the National Corrections Reporting Program (NCRP) modules on prison releases and prison standing populations. The NCRP is a voluntary program through which states submit records for each admission and release from prison over the course of a calendar year. While each record represents a person, individuals are not identified in the record and may be present twice in an admission or release file. NCRP data are collected by the U.S. Census Bureau and cleaned and reviewed by the Bureau of Justice Statistics (BJS). They are housed for public use at the National Archive of Criminal Justice Data (NACJD), part of the Inter-University Consortium for Political and Social Research. Pew submitted a request to the NACJD and received NCRP data from 1985 through 2009, with the exception of a few years for which data were not available.
After cleaning the data and applying filters as discussed below, Pew identified 36 states with sufficient data in the NCRP to make estimates for the period 1990 to 2009 (35 states excluding Maryland, which, although it had full data, did not contain admissions data and therefore could not be directly compared with the others). A list of these states is available at pewstates.org/publicsafety.
To check the reliability of the NCRP data, Pew compared it to other published sources of information on prison populations and releases. NCRP reports custody counts, meaning that it includes records for all persons entering and exiting the state prison system, regardless of the jurisdiction under which they were sentenced. This may be partially responsible for substantial variation between the NCRP and other published state numbers (the most widely used source of aggregate numbers for state prison admissions, releases, and populations are the National Prisoner Statistics [NPS] series from the BJS, which report jurisdiction counts) identified by John F. Pfaff in his 2009 paper on time served in prison.40
Nevertheless, Pew compared total releases by state from the NCRP with release numbers published in the NPS for the years 1988 to 2009. In addition, Pew compared stock population numbers to NPS population numbers from 2005 and 2009. Overall, states reporting in the 2009 NCRP provide 3 percent higher release numbers than are reported in the NPS, and 2 percent lower population numbers.
Pew found substantial variation between NCRP and NPS total release numbers by state. In four states (Alaska, Maryland, North Carolina, and South Carolina) these discrepancies were significantly reduced when individuals with sentences less than a year were removed from the release cohort, indicating that they were probably due to states submitting information from unified prison/jail systems to NCRP. Pew identified an additional four states (Arkansas, Minnesota, Mississippi, and Texas) in which the NPS 2005 Mid-Year Report showed substantial variation between prison population custody counts and jurisdiction counts, indicating that the structure of these state systems and/ or custody arrangements in the states may have contributed to variation in the custody and jurisdiction release numbers as well. Of the 36 states Pew used in the analysis, this left three with substantial variation between NCRP and NPS numbers (Georgia, Iowa, and Washington).
Washington was the only remaining problem state that also shows discrepancies in the stock population counts. When comparing NCRP population data from 2005 with NPS custody and jurisdiction data, Pew confirmed that the NCRP counts in Texas and Minnesota more closely matched NPS custody counts than jurisdiction counts (with the Texas count matching very closely). Arkansas NCRP population counts showed discrepancies with both forms of NPS counts, and will bear further scrutiny as well. Mississippi did not report stock population data in 2005 and so cannot be directly compared.
In the early stages of the project, Pew surveyed state departments of corrections to determine whether gaps in the NCRP could be filled directly by states. While survey questions and definitions were written to match NCRP data collection, the aggregate data submitted were not, ultimately, comparable to NCRP results due to difficulty in precisely matching filters, queries, and offense categories.
MethodologyPew estimated average (mean) sentence length, average time served, and average percentage of maximum sentence served by exit cohort for each available year of data from 1990 to 2009. These numbers were estimated by state and offense category.
Pew also calculated the expected time served for 2005 and 2009 using the reciprocal of the exit rate as suggested by Patterson and Preston.41
Pew was primarily interested in time served by people sentenced to state prison and released for the first time on the current sentence (as opposed to people who had served their sentence, been released, and were re-incarcerated for a parole violation). This group is generally referred to as “first releases.” To limit the analysis to first releases, Pew:
• Dropped all records for which total sentence (variable 34) was shorter than 12 months in order to exclude offenders who served a jail sentence rather than a prison sentence but were submitted to NCRP because of unified jail/prison systems in some states.42
• Dropped all records in which admission type (variable 16) was not court commitment or probation revocation (for most years there are multiple codes for probation revocation including “Suspended sentence imposed” “Probation revocation with new sentence” “Probation revocation with no new sentence” “Probation revocation, no information regarding new sentence” and “Probation status, pending revocation”).
Admission type was missing in certain states and years. In these states, Pew imputed admission type using a logit regression of admission type on offense category and time served in prison in a year with complete admissions data to predict whether individual records were likely to be new court commitments or parole commitments. The predicted value from the logit model was used to weight records when calculating time served and percentage of sentence served, so that records that were more likely to be first releases were given greater weight in the calculation than records that were more likely to be returned parolees. This imputation was completed for records in Mississippi, Nevada, New York, North Carolina, Oklahoma, Oregon, Pennsylvania, South Carolina, Tennessee, and Texas. See jurisdiction notes for the specific years for which admissions data were imputed in these states. Admission type could not be imputed in Maryland because there were no years in which admission type was reported.
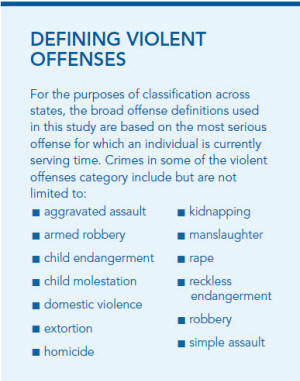
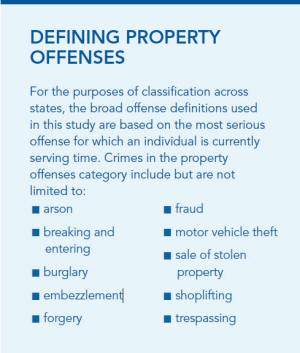
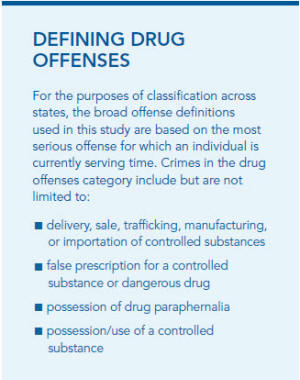
All records were then divided into four offense categories defined as: violent, property, drug, and other. Offenders were placed in an offense category based on the crime for which they received the longest sentence (variable 32). These offense categories were mutually exclusive, and were based on the NCRP codebooks for the years in question. A list of NCRP offense codes from the 2009 NCRP codebook, grouped by offense category, is available upon request. In addition, Pew created a flag for records in which the offense with the longest sentence was murder or homicide. This is a subset of the violent offense category.
Pew then did the following calculations for each record:
Total sentence length• Sentence length refers to the maximum sentence that an offender may be required to serve for the most serious offense. In the NCRP data we used total sentence length as calculated by BJS (variable 34). This usually equals the maximum sentence for the offense with the longest possible sentence (variable 33). In some cases the total sentence is higher, presumably reflecting multiple offenses to be served consecutively.
• If variable 34 (total sentence) was missing, we replaced it with variable 33 (maximum sentence).
• Sentences longer than 1,500 months (125 years) in variable 34 were replaced by variable 33 if the value was different and less than 1,500 months. If variable 33 was also over 1,500 months or was missing, these sentences were marked as missing and were not used in calculations.
• Life sentences were counted as 30 years or 360 months.
Total time served• Total time served = Time served on current admission (as measured by difference between admission date and release date) (variable 62) + Prior jail time served credited to the current sentence (variable 24).
• If prior jail time is missing, we imputed it as the mean of jail time for that year and offense category and flagged the record. The year with the most missing jail time records was 1990, when 32 percent of records had imputed jail time. This number went as low as 5 percent in 1998. On average across years, about 19 percent of records required this imputation.
Percentage of sentence served• Percentage of sentence served was calculated as total time served divided by total sentence as defined above.
• Percentage of sentence served was allowed to be above 100 percent. To create yearly estimates for each state/ year/offense category combination from 1990 to 2009, we used a centered moving average within each state and offense category comprising one year before, the current year, and one year in the future. If one of these time periods was unavailable, the other two were still used. If two or more were unavailable, we used any periods available within two years on either side of the year in question. Though we created estimates only for 1990 on, we used 1989 data when available to create 1990 estimates.
The later years posed a problem because we had available only 2005, 2008, and 2009. To be as conservative as possible while bridging this gap, we calculated 2005 estimates using 2004, 2005, and 2008; 2008 estimates using 2005, 2008, and 2009; and 2009 estimates using 2008 and 2009.
Standard errors were calculated using the entire three-year period upon which the average was calculated. If fewer years were used in the calculation then the standard errors will be larger (because they rely on a smaller number of records).
These moving average estimates by state, year, and offense type were made for:
• Sentence length
• Time served
• Percentage of sentence served
We estimated the number of releases in each year by offense category and the stock population in each offense category at the end of year.
• Count of releases = The number of individual records in the release file of the NCRP that fit the above filters.
• Stock population = The number of individual records in the stock file of the NCRP that fit the above filters (available only for 2005 and 2009).
Finally, Pew reviewed each state’s data looking for inconsistencies and outliers both in the individual-level data and in the aggregate counts and averages. Any problems with specific states, years, or variables were flagged for follow-up. In cases where data were systematically unreliable within a particular state and year, the problem variable or state/year combination was discarded and when possible replaced with estimates from other years.
Expected Time ServedFor the purposes of creating the expected time served measure, Pew weighted the total number of releases and stock to fit counts released through the NPS series. These may vary for the reasons discussed above (custody vs. jurisdiction) but because they have been independently validated, we believed they were more appropriate for the purpose of extrapolating totals. Thus we created a weight for each observation based on the ratio of the NPS total (either releases or stock population) and the NCRP total. These weights were created based on the total NCRP file (all releases) to match the NPS as closely as possible. NCRP files were then filtered as described above to include only “first releases” and releases and stock population totals were calculated using the weights created above. Because we looked at first releases, our totals do not equal the NPS totals, however ours were weighted to consistently fit with NPS reports.
Expected time served was calculated as the reciprocal of the exit rate, that is by dividing the weighted stock population by the weighted number of releases for each year and offense category. This measure can be adjusted for population growth; however, this adjustment does not make a significant difference in the results and therefore was not used.43 To make it comparable to the average time served measure, which included jail time, Pew then adjusted the expected time served to include the average time spent in jail counted toward an individual’s sentence by year and offense category.
Standard errors for the expected time served measure were calculated using the delta method, which uses a first-order Taylor series approximation to calculate the variances of a transformed variable.
Jurisdiction NotesMaryland: Had no admission type data for any year, meaning Pew was unable to exclude parolees. We therefore report the trends for Maryland but not the absolute values of time served.
Missouri: There were no data on time served for 2004, so it was estimated from other available years.
Mississippi: Had no admission type information for the years 1994, 1995, 1996, 1997, 1998, 1999, 2000, and 2001. Each record in these years was assigned a probability of being a first release as described above based on data from 2002.
Nevada: Had no admission type information for the years 1994, 1995, 1996, 1997, 1998, 1999, 2000, and 2001. Each record in these years was assigned a probability of being a first release as described above based on data from 2002.
New York: Had no admission type information for the years 1989, 1990, 1991, 1992, 1993, and 1994. Each record in these years was assigned a probability of being a first release as described above based on data from 1995.
North Carolina: Had no admission type information for the years 1995, 1996, 1997, 1998, 1999, 2000, 2001, 2002, 2003, 2004, 2005, 2008, and 2009. Each record in these years was assigned a probability of being a first release as described above based on data from 1992, 1993, and 1994. Three years were used for the imputation due to small sample sizes.
Ohio: Due to irregularities in the 2002 data, information from that year was dropped.
Oklahoma: Had no admission type information for the years 1991, 1992, 1993, 1994, 1995, 1996, 1997, 1998, 1999, 2000, 2001, and 2002. Each record in these years was assigned a probability of being a first release as described above based on data from 2005, due to issues with 2003 and 2004 data.
Oregon: Had no admission type information for the years 1989, 1990, 1998, 1999, 2000, 2001, and 2008. Each record in these years was assigned a probability of being a first release as described above based on data from 1997 and 2002.
Pennsylvania: Had no admission type information for the years 1994, 1995, 1996, and 1997. Each record in these years was assigned a probability of being a first release as described above based on data from 1998.
South Carolina: Had no admission type information for the years 1994, 1995, 1996, 1997, 1998, 1999, 2000, and 2001. Each record in these years was assigned a probability of being a first release as described above based on data from 2002.
Tennessee: Had no admission type information for the years 1989, 1990, and 1991. Each record in these years was assigned a probability of being a first release as described above based on data from 1995 and 1996 due to issues with 1992, 1993, and 1994 data.
Texas: Had no admission type information for the years 1989, 1990, 1991, 1992, 1993, 1994, 1995, 1996, 1997, and 1998. Each record in these years was assigned a probability of being a first release as described above based on data from 2001 due to issues with 1999 and 2000 data.
Tables A1, A2, A3, and A4 present estimates for every five years, by state and offense type. These estimates include 95 percent confidence intervals, calculated as described above. Expected time served also is included when it was calculable from available data.Appendix Table A1. Confidence Intervals for Time Served Estimates, All Crimes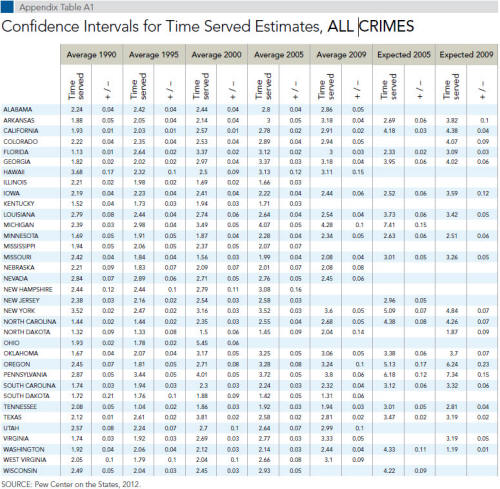 SOURCE: Pew Center on the States, 2012.Appendix Table A2. Confidence Intervals for Time Served Estimates, Violent CRIMES
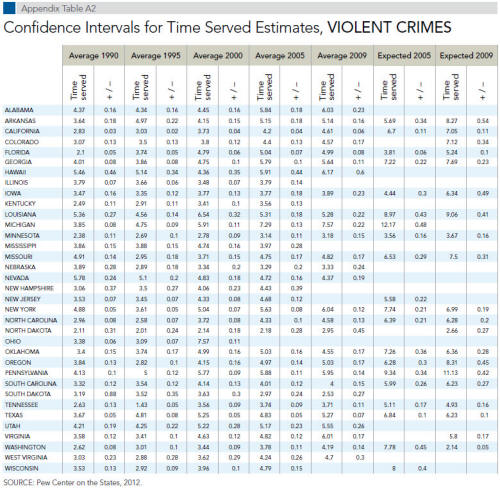 SOURCE: Pew Center on the States, 2012.Appendix Table A3. Confidence Intervals for Time Served Estimates, Property Crimes
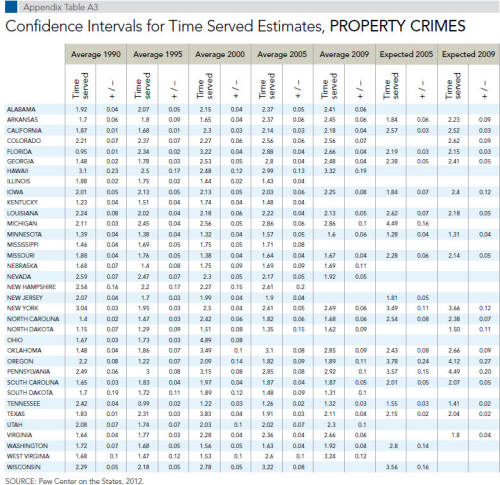 SOURCE: Pew Center on the States, 2012.Appendix Table A4. Confidence Intervals for Time Served Estimates, Drug Crimes
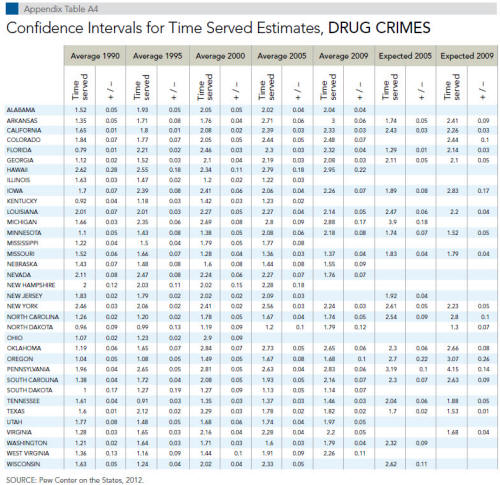 SOURCE: Pew Center on the States, 2012.