10. Summary and concluding remarks
Median wealth showed robust growth during the 1980s and 1990s and an even faster advance from 2007 to 2010. Then the Great Recession hit. From 2007 to 2010, house prices fell by 24 percent in real terms, stock prices by 26 percent, and median wealth by a staggering 47 percent. Median income also dropped but by a relatively modest 6.4 percent. The percent of households with nonpositive net worth rose sharply from 18.6 to 22.5.
Wealth inequality after remaining relatively stable from 1989 to 2007 showed a steep increase over the Great Recession. The Gini coefficient climbed from 0.834 to 0.870 and the share of the top 20 percent from 85 to 89 percent. The share of the bottom 40 percent experienced a precipitous drop from 0.2 to -0.9 percent. In contrast, income inequality, after rising moderately from 2000 to 2007 (an increase of 0.12 Gini points), dropped substantially from 2006 to 2009 (a decrease of 0.25 Gini points).
The percentage increase in net worth (also income) from 1983 to 2010 was much greater for the top wealth (and income) groups than for those lower in the distribution. The greatest gains were enjoyed by the upper 20 percent, particularly the top one percent, of the respective distributions. Between 1983 and 2010, the top one percent received 38 percent of the total growth in net worth and 39 percent of the total increase in income. The figures for the top 20 percent are 101 percent and 104 percent, respectively – that is to say, the upper quintile got it all!.
The years 2001 to 2007 also saw a sharply rising debt to income ratio, reaching its highest level in almost 25 years, at 1.19 among all households in 2007. The debt-equity ratio was also way up, from 0.14 to 0.18. Most of the rising debt was from increased mortgages on homes. From 2007 to 2010 both ratios rose, the former moderately from 1.19 to 1.27 and the latter more steeply from 0.18 to 0.21. This was true despite a moderate retrenchment of overall average debt of 4.4 percent and reflected the drop in both mean wealth and income.
Home values as a share of total assets among all households remained relatively unchanged from 1983 to 2010 (around 30 percent). However, net home equity as a share of total assets fell from 0.24 in 1983 to 0.18 in 2010, reflecting rising mortgage debt on homeowner's property, which grew from 21 percent in 1983 to 35 percent in 2007 and then jumped to 41 percent in 2010. The large increase in the ratio from 2007 to 2010 was a result of falling home values (average mortgage debt actually declined by 5.0 percent in absolute terms).
Trends are more pronounced for the middle class. Among the middle three wealth quintiles, there was a huge increase in the debt-income ratio from 1.00 in 2001 to 1.57 in 2007 and an almost doubling of the debt-equity ratio from 0.32 to 0.61 percent. The debt-equity ratio was also much higher among the middle 60 percent of households in 2007, at 0.61, than among the top one percent (0.028) or the next 19 percent (0.121). However, from 2007 to 2010, while the debt-equity ratio continued to advance to 0.72, the debt to income ratio actually fell off to 1.35. The reason is the substantial retrenchment of average debt among the middle class over these years. Overall debt fell by 25 percent in real terms, mortgage debt by 23 percent, and other debt by 32 percent. The fact that the debt-equity ratio rose over these years was a reflection of the steep drop in median net worth.
Despite the 24 percent plunge in house prices (in real terms) from 2007 to 2010, the share of home owners who were underwater was “only” 8.2 percent in 2010. However, average home equity among home owners did decline by 26 percent. This reduction would have been higher except for the contraction of mortgage debt noted above. Hispanics, younger households, and middle income households were hit particularly hard in terms of the loss of home equity.
One piece of mainly positive news is that among all households there was no deterioration in pension accumulations in DC-type pension plans over the Great Recession. The share of households with a DC account, after rising from 11 percent in 1983 to 53 percent in 2007, did fall off a bit to 50 percent in 2010. However, average DC pension wealth continued to grow from 2007 to 2010. The main reason was a shifting of household portfolios. Pension accounts as a share of total assets, after rising from 1.5 percent in 1983 to 12 percent in 2007, jumped to 15 percent in 2010. However, among middle class families, the share with a DC plan, after growing robustly from 12 percent in 1983 to 53 percent in 2007, fell off sharply to 46 percent in 2010, and the change in dollar terms from 2007 to 2010 was -24 percent. Thus, in terms of retirement preparedness from DC accounts, there was generally an improvement from 2007 to 2010 except for middle class households.
The key to understanding the plight of the middle class over the Great Recession was their high degree of leverage and the high concentration of assets in their home. The steep decline in median net worth between 2007 and 2010 was primarily due to the very high negative annual rate of return on net worth of the middle three wealth quintiles (-8.9 percent). This, in turn, was attributable to the precipitous fall in home prices and their very high degree of leverage. High leverage, moreover, helps explain why median wealth fell more than house (and stock) prices over these years and declined much more than median household income.
The large spread in rates of return on net worth between the middle three wealth quintiles and the top quintile (over a point and a half lower) also largely explained why wealth inequality increased steeply from 2007 to 2010 despite the decline in income inequality. Indeed, the middle class took a bigger relative hit on their net worth from the decline in home prices than the top 20 percent did from the stock market plunge. This factor is also reflected in the fact that median wealth dropped much more in percentage terms than mean wealth over the Great Recession. The evidence, moreover, suggests that middle class households went into debt partly in order to increase their leverage and to raise their rate of return, at least when asset prices were rising. Of course, the increased leverage also made them very vulnerable when asset prices collapsed.
The racial disparity in wealth holdings, after fluctuating over the years from 1983 to 2007, was almost exactly the same in 2007 as in 1983. However, the Great Recession hit black households much harder than whites and the ratio of mean wealth between the two groups plunged from 0.19 in 2007 to 0.14 in 2010, mainly due to a 34 percent decline (in real terms) in African-American wealth. The relative (and absolute) losses suffered by black households from 2007 to 2010 are ascribable to the fact that blacks had a higher share of homes in their portfolio than did whites and much higher debt-equity ratios (0.55 and 0.15, respectively).
Hispanic households made sizeable gains on (non-Hispanic) white households from 1983 to 2007. The ratio of mean net worth grew from 0.16 to 0.26, the homeownership rate among Hispanic households climbed from 33 to 49 percent, and the ratio of homeownership rates with white households advanced from 48 percent in 1983 to 66 percent in 2007. However, in a reversal of fortunes, Hispanic households got hammered by the Great Recession. Their mean net worth plunged in half, the ratio of mean net worth with white households fell from 0.26 to 0.15, their home ownership rate fell by 1.9 percentage points, and their net home equity plummeted by 48 percent. The relative (and absolute) losses suffered by Hispanic households over these three years are also mainly due to the much larger share of homes in their wealth portfolio and their much higher debt-equity ratio (0.51 versus 0.15). Another likely factor is that a high percentage of Hispanics bought their homes close to the housing cycle peak.
Young households also got pummeled by the Great Recession. The ratio of net worth between households under age 35 and all households fell from 0.21 in 1983 to 0.17 in 2007 and then plunged to 0.10 in 2010. In (real) dollar terms, their mean net worth declined by 49 percent from 2007 to 2010. Among age group 35-44, the ratio of their net worth to the overall figure fell from 0.71 in 1983 to 0.58 in 2007 and then declined precipitously to 0.41 in 2010. In dollar terms, their wealth fell by 42 percent over the latter three years. The same two factors explain the losses suffered by young households – the higher share of homes in their wealth portfolio and their much higher leverage ratios.
The Asset Price Meltdown and the Wealth of the Middle Class
14 posts
• Page 2 of 2 • 1, 2
Re: The Asset Price Meltdown and the Wealth of the Middle Cl
![]() by admin » Mon Oct 19, 2015 8:48 pm
by admin » Mon Oct 19, 2015 8:48 pm
- admin
- Site Admin
- Posts: 36183
- Joined: Thu Aug 01, 2013 5:21 am
Re: The Asset Price Meltdown and the Wealth of the Middle Cl
![]() by admin » Mon Oct 19, 2015 8:48 pm
by admin » Mon Oct 19, 2015 8:48 pm
References
Kennickell, Arthur B. 2001. "Modeling Wealth with Multiple Observations of Income: Redesign of the Sample for the 2001 Survey of Consumer Finances," October, at: http://www.federalreserve.gov/pubs/oss/oss2/method.html.
Kennickell, Arthur B., and R. Louise Woodburn. 1999. "Consistent Weight Design for the 1989, 1992, and 1995 SCFs, and the Distribution of Wealth." Review of Income and Wealth 45: 193- 216.
Wolff, Edward N. 1980. “Estimates of the 1969 Size Distribution of Household Wealth in the U.S from a Synthetic Data Base.” In James Smith ed., Modeling the Distribution and Intergenerational Transmission of Wealth, Chicago: Univ. of Chicago Press, 1980, pp. 223-271.
Wolff, Edward N. 1979. "The Distributional Effects of the 1969-75 Inflation on Holdings of Household Wealth in the United States." Review of Income and Wealth series 25(2): 195-207.
-----. 1987. "Estimates of Household Wealth Inequality in the United States, 1962-83." Review of Income and Wealth series 33: 231-256.
-----. 1994. "Trends in Household Wealth in the United States, 1962-1983 and 1983-1989." Review of Income and Wealth 40: 143-174.
-----. 1998. "Recent Trends in the Size Distribution of Household Wealth." Journal of Economic Perspectives, 12: 131-150.
-------. 2002a. TOP HEAVY: A Study of Increasing Inequality of Wealth in America. Newly updated and expanded edition, New York: the New Press.
------. 2011a. “Recent Trends in Household Wealth in the U.S.: Rising Debt and the Middle Class Squeeze.” In Jason M. Gonzales, ed., Economics of Wealth in the 21st Century. Nova Science Publishers, Inc., pp. 1-41.
-----. 2011b. The Transformation of the American Pension System: Was It Beneficial for Workers? , Kalamazoo, Michigan : W.E. Upjohn Institute for Employment Research.
- admin
- Site Admin
- Posts: 36183
- Joined: Thu Aug 01, 2013 5:21 am
Re: The Asset Price Meltdown and the Wealth of the Middle Cl
![]() by admin » Mon Oct 19, 2015 8:50 pm
by admin » Mon Oct 19, 2015 8:50 pm
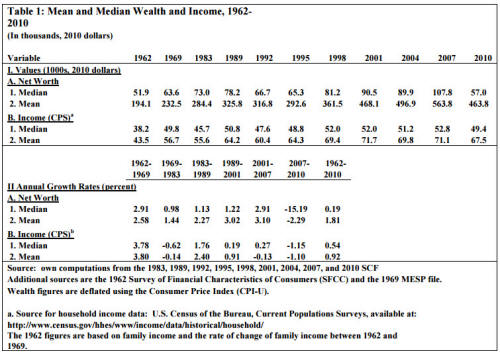
Table 1: Mean and Median Wealth and Income, 1962- 2010 (In thousands, 2010 dollars)
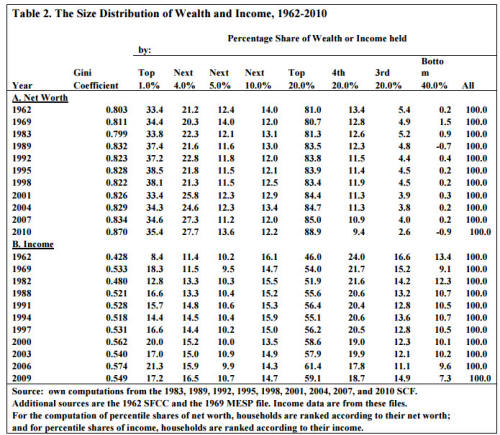
Table 2. The Size Distribution of Wealth and Income, 1962-2010
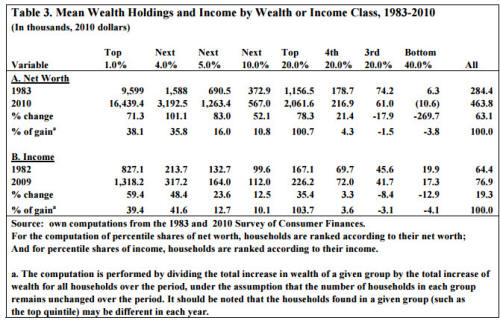
Table 3. Mean Wealth Holdings and Income by Wealth or Income Class, 1983-2010 (In thousands, 2010 dollars)
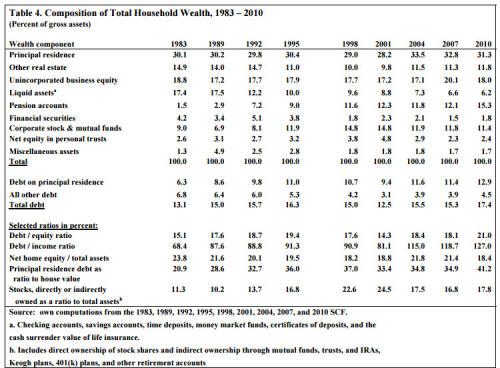
Table 4. Composition of Total Household Wealth, 1983 – 2010 (Percent of gross assets)
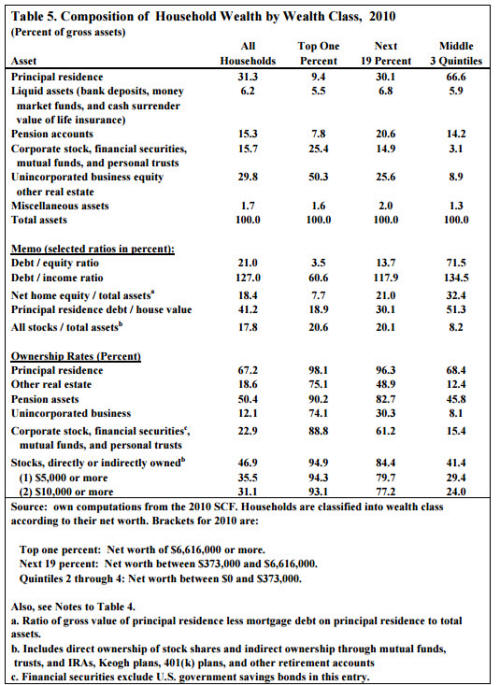
Table 5. Composition of Household Wealth by Wealth Class, 2010 (Percent of gross assets)
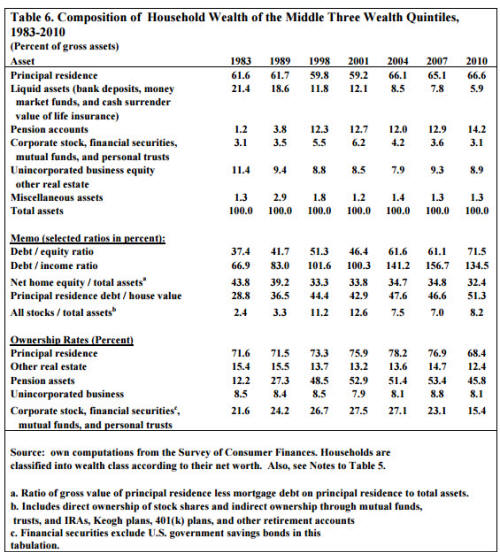
Table 6. Composition of Household Wealth of the Middle Three Wealth Quintiles, 1983-2010 (Percent of gross assets)
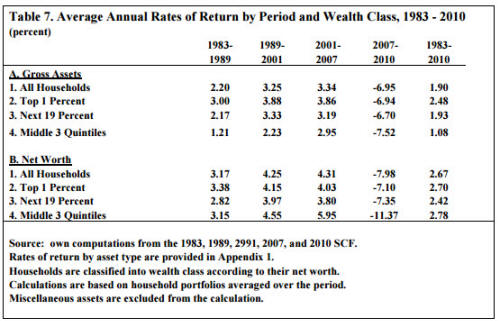
Table 7. Average Annual Rates of Return by Period and Wealth Class, 1983 - 2010 (percent)
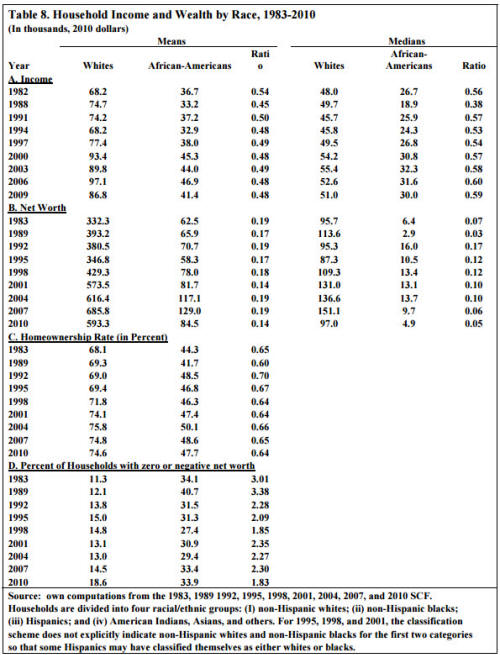
Table 8. Household Income and Wealth by Race, 1983-2010 (In thousands, 2010 dollars)
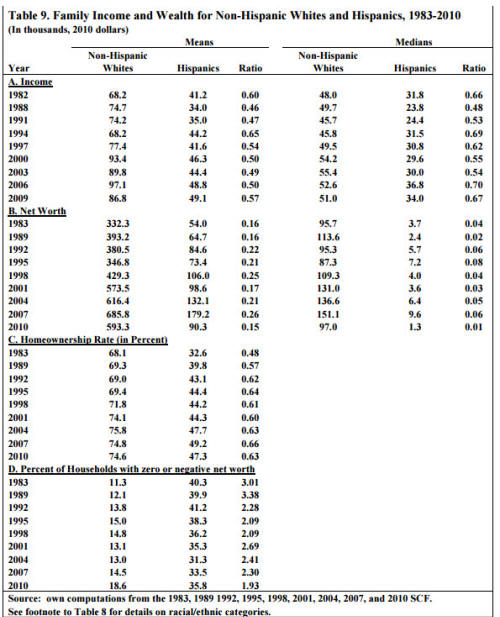
Table 9. Family Income and Wealth for Non-Hispanic Whites and Hispanics, 1983-2010 (In thousands, 2010 dollars)
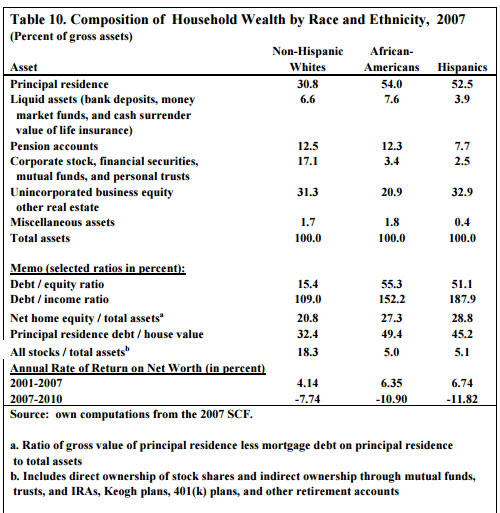
Table 10. Composition of Household Wealth by Race and Ethnicity, 2007 (Percent of gross assets)
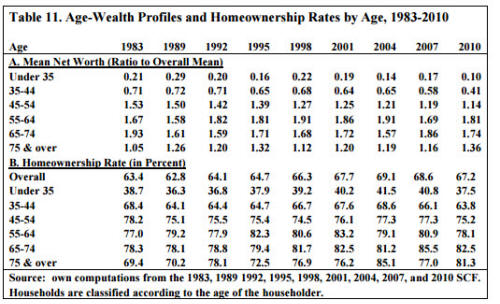
Table 11. Age-Wealth Profiles and Homeownership Rates by Age, 1983-2010
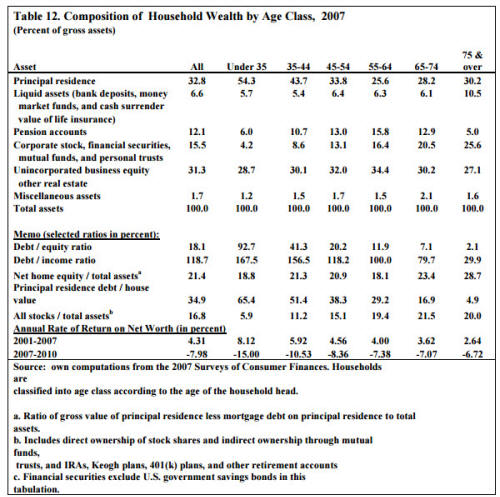
Table 12. Composition of Household Wealth by Age Class, 2007 (Percent of gross assets)
- admin
- Site Admin
- Posts: 36183
- Joined: Thu Aug 01, 2013 5:21 am
Re: The Asset Price Meltdown and the Wealth of the Middle Cl
![]() by admin » Mon Oct 19, 2015 8:51 pm
by admin » Mon Oct 19, 2015 8:51 pm
_______________
Notes:
1 The source for housing price data, unless otherwise indicated, is Table 935 of the 2009 Statistical Abstract, US Bureau of the Census, available at [http://www.census.gov/compendia/statab/].
2 The source is National Association of Realtors, “Median Sales Price of Existing Single-Family Homes for Metropolitan Areas,” available at: http://www.realtor.org/sites/default/fi ... me-prices- 49bc10b1efdc1b8cc3eb66dbcdad55f7/metro-home-prices-q1-single-family-2012-05-09.pdf.
3 The source for stock price data is Table B-96 of the Economic Report of the President, 2012, available at http://www.gpoaccess.gov/eop/tables12.html.
4 The wage figures are based on the Bureau of Labor Statistics (BLS) hourly wage series. The source is Table B-47 of the Economic Report of the President, 2012, available at op. cit. The source for the income data is Table B-33 of the Economic Report of the President, 2012, available at op. cit.
5 The figure is for civilian employment. The source is Table B-36 of the Economic Report of the President, 2012, available at op. cit.
6 The source is Table B-42 of the Economic Report of the President, 2012, available at op. cit.
7 These figures are based on the Federal Reserve Board’s Flow of Funds data, Table B.100, available at: http://www.federalreserve.gov/releases/Z1/.
8 Unfortunately, no data on educational loans are available in the 2001 SCF.
9 The computation of DB pension wealth is based on the present value of expected pension benefits upon retirement. See Wolff (2011b) for details.
10 Another rationale is that if cars are included in the household portfolio, their “rate of return” would be substantially negative since cars depreciate very rapidly over time (see Section 8 for calculations of the overall rate of return on the household portfolio).
11 See Wolff (2011b) for estimates of Social Security and pension wealth.
12 The percentage decline in net worth from 2007 to 2010 is lower when vehicles are included in the measure of wealth – “only” 39 percent. The reason is that automobiles comprise a substantial portion of middle class wealth.
13 The decline in mean net worth is 15 percent when vehicles are included in net worth.
14 Actually, the big slippage in the share of the top one percent occurred between 1998 and 2001. The main reason appears to be a sizeable drop in the share of households in the top one percent owning their own business, from 72 to 66 percent. Whereas the mean net worth of the top one percent increased by 13.5 percent in real terms, the mean value of unincorporated business equity and other real estate grew by only 6.2 percent.
15 It might seem somewhat surprising that wealth inequality remained relatively unchanged during the latter part of the George Bush administration, the Clinton administration, and the George W. Bush administration. However, as we shall see in Section 8, stability in wealth inequality over these years was due largely to the sharp increase in the relative indebtedness of the middle class.
16 Once again, the main culprit explaining the rather meager increase in the share of the top one percent is unincorporated business equity, whose mean value fell by 26 percent in real terms from 2007 to 2010, compared to a 16 percent overall decline in their mean net worth.
17 It should be noted that the income in each survey year (say 2007) is for the preceding year (2006 in this case).
18 The 1969 MESP data suggest a huge expansion in income inequality from 1962 to 1969 but it is likely that the income data in the MESP file are flawed.
19 It should be noted that the SCF data show a much higher level of income inequality than the CPS data. In the year 2000, for example, the CPS data show a share of the top five percent of 22.1 percent and a Gini coefficient of 0.462. The difference is primarily due to three factors. First, the SCF oversamples the rich (as noted above), while the CPS is a representative sample. Second, the CPS data are top-coded (that is, there is an open-ended interval at the top, typically at $75,000 or $100,000), whereas the SCF data are not. Third, SCF income definition includes realized capital gains whereas the CPS definition does not. However, the CPS data also show a large increase of inequality between 1989 and 2000, with the share of the top five percent rising from 18.9 to 22.1 percent and the Gini coefficient from 0.431 to 0.462. .
20 The CPS data, in contrast, shows little change in household income inequality, with the Gini coefficient falling slightly from 0.470 in 2006 to 0.468 in 2009. The source for the CPS data is: http://www.census.gov/hhes/www/income/d ... 4_2010.xls. However, the work of Emmanuel Saez and Thomas Piketty, based on IRS tax data, reveals a sizeable decline in income inequality from 2007 to 2010. In particular, incomes at the 99.99th, 99.9th, and 99th percentile drop sharply over these years (the source is: New York Times, October 24, 2012, page A14).
21 It may seem surprising that the share of housing in gross assets declined very little between 2007 and 2010, given the steep drop in housing prices, but the price of other assets also fell over this period, particularly those of stocks and business equity.
22 An earlier analysis was conducted by the author for the 1969-1975 period in the U.S. See Wolff (1979) for details.
23 The residual group, American Indians and Asians, is excluded here because of its small sample size.
24 It should be noted that the unit of observation is the household, which includes both families (two or more related individuals living together), as well as single adults. As is widely known, the share of female-headed households among African-Americans is much higher than that among whites. This difference partly accounts for the relatively lower income and wealth among African-American households.
25 The 1988 income figure for black households appears to be an outlier. The low income for blacks in that year probably reflects the small sample size for blacks (and Hispanics as well) and the survey-to-survey sample variability.
26 There was almost no change in the relative home ownership rates of the two groups – both experienced moderate losses – while the share of households with non-positive net worth actually increased more in relative terms for white households than black ones. Unfortunately, there are no data available to separate out actual declines in house prices for white, black, and Hispanic homeowners.
27 As with racial minorities, the sample size is relatively small for the oldest age group, so that the 9 percentage point increase in their homeownership rate from 2001 to 2004 may be due to sampling variation.
28 As in 2007, the principal source of debt was mortgage debt, which comprised 70 percent of the total debt for the youngest age group in 2010. However, educational loans now amounted to 15 percent of their total liabilities, up from 10 percent in 2007, and 40 percent of households in this age group had an outstanding student loan in 2010.
29 This pattern may also be partly a cohort effect since 401(k) plans and other defined contribution plans were not widely introduced into the workplace until after 1989.
- admin
- Site Admin
- Posts: 36183
- Joined: Thu Aug 01, 2013 5:21 am
14 posts
• Page 2 of 2 • 1, 2
Return to Investigations of Government
Who is online
Users browsing this forum: No registered users and 10 guests