Five Decades of Missing Females in China*
by Ansley J. Coale and Judith Banister
Demography, Vol. 31, No.3, August 1994
Copyright © 1994 Population Association of America
NOTICE: THIS WORK MAY BE PROTECTED BY COPYRIGHT
YOU ARE REQUIRED TO READ THE COPYRIGHT NOTICE AT THIS LINK BEFORE YOU READ THE FOLLOWING WORK, THAT IS AVAILABLE SOLELY FOR PRIVATE STUDY, SCHOLARSHIP OR RESEARCH PURSUANT TO 17 U.S.C. SECTION 107 AND 108. IN THE EVENT THAT THE LIBRARY DETERMINES THAT UNLAWFUL COPYING OF THIS WORK HAS OCCURRED, THE LIBRARY HAS THE RIGHT TO BLOCK THE I.P. ADDRESS AT WHICH THE UNLAWFUL COPYING APPEARED TO HAVE OCCURRED. THANK YOU FOR RESPECTING THE RIGHTS OF COPYRIGHT OWNERS.
Ansley J. Coale
Senior Research Demographer
Office of Population Research
Princeton University
21 Prospect Avenue
Princeton, NJ 08540-2091
E-mail: coale@opr.Princeton.EDU
Judith Banister
Chief, Center for International Research
Bureau of the Census
Washington, DC 20233-3700
This paper seeks to explain the dearth of females in the population of China in cohorts born from the late 1930s to the present. We demonstrate that in virtually all cohorts, the shortage of females in comparison with males is revealed when the cohort is first enumerated in a census. Subsequently it barely changes, an indication that female losses occur very early in life. Using the high-quality data from the censuses and fertility surveys in China, we show that many of the births of the girls missing in the censuses were not reported in the surveys because they died very young. The incidence of excess early female mortality (probably infanticide) declined precipitously in the Communist period, but not to zero. The recent escalation in the proportion of young females missing in China has been caused largely by rapidly escalating sex-selective abortion.
INTRODUCTION
In the absence of special circumstances reducing the number of the male or the female members of a population, and in the absence of substantial gains or losses from migration, the numbers of males and females are approximately equal. These approximately equal numbers are the result of the usual slight majority of males at birth, and the usual somewhat higher mortality of males in the absence of differential treatment of the sexes or a large incidence of military mortality. In almost all well-recorded ratios of the number of male to the number of female births, the ratio falls between 1.05 and 1.07; the slightly higher male mortality gradually cancels the initial male majority as each cohort advances in age.
In some Asian and African countries, however, the ratio of males to females in the population is higher than would be expected from the typical sex ratio at birth and the typical differential mortality. The source of this high masculinity is female mortality that is higher, in relation to male mortality, than would prevail if both sexes had equal access to factors promoting good health. One of the populations with higher than expected masculinity is that of the People's Republic of China. In the 1990 census, the recorded ratio of males to females was 1.066; a normal sex ratio at birth and normal differences in survival would have yielded a ratio no higher than 1.02. Female mortality evidently has been abnormally high in relation to male mortality in China.
In this paper we analyze data from the four modern censuses of China, held from 1953 to 1990, and from two large-scale retrospective fertility surveys, held in 1982 and 1988, to trace the record of excess masculinity in successive Chinese birth cohorts from those born in the late 1930s to those born in the late 1980s. The extent and the high quality of the data permit several inferences, including the probable existence of high rates of female infanticide in the 1930s and early 1940s; a large reduction of this practice by the 1960s; the effect of the famine in 1959-1961 on the sex ratio in selected cohorts; evidence of the beginning, around 1970, of selective termination of childbearing following a male birth; and, in the 1980s, the emerging impact of sex-selective abortion on the sex ratio at birth.
We begin with a description of the relevant data in the Chinese censuses and in the large fertility surveys of the 1980s. Then we present an analysis of the data for cohorts born from 1936 to 1954, for cohorts whose childhood years occurred during the great famine of 1959-1961, for cohorts born before and during the national introduction of a family planning program, and for cohorts born in the 1980s.
RATIOS OF MALES TO FEMALES, BY BIRTH COHORT, IN THE CHINESE CENSUSES
The four modern censuses of China provide data of unusually high quality, which are especially suitable for examining the ratio of males to females at different ages. The absence of any consequential amount of international migration ensures that the relative number of males and females at each age is determined by the ratio of males to females at birth in each cohort, and by the relative survival (or, conversely, by the relative number of deaths) to which each cohort has been subject since birth.
A positive feature of the censuses is the unusual precision with which age is listed. Accurately listed ages are possible because of a characteristic of the dominant culture in China: every individual, even if illiterate, knows the exact date of his birth according to the Chinese calendar. Each year in this calendar has the name of an animal with a specified characteristic in a 60-year cycle of 12 animals and five characteristics for each animal. Within each year, "months" are lunar months; each individual knows the day of the lunar month in the animal year in which he was born. The accuracy of recall of this date is based on the astrological belief in the importance of date of birth in determining such decisions as marriage or change of residence. Each individual knows this fixed date and can supply it readily. For example, Chinese graduate students at Princeton report that parents or grandparents often have told them not only the date of their birth, but also the hour of the day. In conducting a census it is necessary to ask each individual the date of his or her birth, then to translate this date into the Western calendar and subtract it from the date of the census to obtain an exact age.1
As our unit of analysis we have chosen the ratio of males to females recorded for persons identified by the years in which they were born, rather than (for example) their age at the date of a census. This use of birth cohorts rather than age is illustrated by the ratios of males to females listed in Table 1. The cohorts have been combined into five-year groupings of birth years to smooth out any minor irregularities in the raw data. The earliest birth cohort listed, born in 1936-1940, was at ages 12-16 in 1953, 23-27 in 1964, 41-45 in 1982, and 49-53 in 1990.2 The ratio of males to females for a given cohort tends to diminish at ages above the mid-thirties because male mortality becomes increasingly higher than female as age advances. A surprising feature of these cohort data is that of 79 instances in which ratios for the same cohort are listed in two consecutive censuses, masculinity is higher at the second date in only six.> Thus, in general, as these cohorts passed through life, the male attrition implied by the numbers recorded in the censuses was equal to or higher than female attrition over the ages reached by each cohort between two censuses. In spite of this normal trend in cohort sex ratios over time, the sex ratios at most ages are higher than would normally be the case.
Table 1. Sex Ratios in Censuses by 5-Year Birth Cohorts from Cohort Born 1936-1940
Census
Years of Birth / 1953 / 1964 / 1982 / 1990
1936-1940 / 1.171 / 1.171 / 1.144 / 1.124
1937-1941 / 1.183 / 1.183 / 1.142 / 1.122
1938-1942 / 1.178 / 1.178 / 1.138 / 1.117
1939-1943 / 1.169 / 1.169 / 1.135 / 1.115
1940-1944 / 1.160 / 1.160 / 1.130 / 1.112
1941-1945 / 1.151 / 1.151 / 1.119 / 1.105
1942-1946 / 1.141 / 1.141 / 1.115 1.102
1943-1947 / 1.129 / 1.129 / 1.108 / 1.099
1944-1948 / 1.117 / 1.117 / 1.102 / 1.095
1945-1949 / 1.107 / 1.107 1.100 / 1.095
1946-1950 / 1.094 / 1.109 / 1.095 / 1.090
1947-1951 / 1.081 / 1.103 / 1.102 / 1.082
1948-1952 / 1.070 / 1.095 / 1.095 / 1.074
1949-1953 / -- / 1.089 / 1.089 / 1.068
1950-1954 / -- / 1.086 / 1.086 / 1.063
1951-1955 / -- / 1.088 / 1.088 / 1.064
1952-1956 / -- / 1.092 / 1.092 / 1.068
1953-1957 / -- / 1.097 / 1.097 / 1.076
1954-1958 / -- / 1.097 / 1.097 / 1.083
1955-1959 / -- / 1.096 / 1.096 / 1.085
1956-1960 / -- / 1.090 1.090 1.079
1957-1961 / -- / 1.082 / 1.082 / 1.072
1958-1962 / -- / 1.072 / 1.072 / 1.066
1959-1963 / -- / 1.062 / 1.062 / 1.056
1960-1964 / -- / -- / 1.056 / 1.050
1961-1965 / -- / -- / 1.054 / 1.054
1962-1966 / -- / -- / 1.056 / 1.056
1963-1967 / -- / -- / 1.953 / 1.053
1964-1968 / -- / -- / 1.057 / 1.057
1965-1969 / -- / -- / 1.059 / 1.059
1966-1970 / -- / -- / 1.060 / 1.060
1967-1971 / -- / -- / 1.060 / 1.060
1968-1972 / -- / -- / 1.060 / 1.060
1969-1973/ -- / -- / 1.061 / 1.061
1970-1974 / -- / -- / 1.061 / 1.061
1971-1975 / -- / -- / 1.062 / 1.062
1972-1976 / -- / -- / 1.062 / 1.060
1973-1977 / -- / -- / 1.062 / 1.062
1974-1978 / -- / -- / 1.063 / 1.065
1975-1979 / -- / -- / 1.066 / 1.068
1976-1980 / -- / -- / 1.069 / 1.070
1977-1981 / -- / -- / 1.071 / 1.072
1978-1982 / -- / -- / -- / 1.077
1979-1983 / -- / -- / -- / 1.081
1980-1984 / -- / -- / -- / 1.083
1981-1985 / -- / -- / -- / 1.085
1982-1986 / -- / -- / -- / 1.088
1983-1987 / -- / -- / -- / 1.090
1984-1988 / -- / -- / -- / 1.096
1985-1989 / -- / -- / -- / 1.102
We can explain in part the six exceptions to the general pattern of declining masculinity of each cohort over time. As shown in Table 1, early cohort sex ratios rose between the 1953 and the 1964 census as the three youngest groups aged into the teen years. This finding suggests that a strong pattern of selective neglect of girls in childhood occurred between 1953 and 1964. As we will discuss, a severe famine intervened between these two censuses. Between the 1982 and the 1990 census, the recorded sex ratio of the three youngest groups rose very slightly; this suggests that selective neglect of young girls continued but was much reduced from earlier decades. The rise in these cohort sex ratios occurred at ages beyond which any female infanticide would have taken place; that tends to occur soon after birth.
To estimate the "excess" mortality to which females have been subject since birth in relation to males in the same cohort, we have made a rough estimate of the normal sex ratio that would be expected in each cohort at each census date. We calculated the normal ratio on the assumption that at birth the ratio of males to females was 1.06; relative survival rates for the two sexes were chosen to match the relative survival in a model life table at a level of mortality that we selected as about equal to the level we estimated as experienced by the given cohort. The normal sex ratio is what one would expect if the cohort began with the nearly universal sex ratio at birth and was subject to the relative survival rates in model life tables based on accurately recorded experience in populations at about the same level of mortality (see Table 2).4
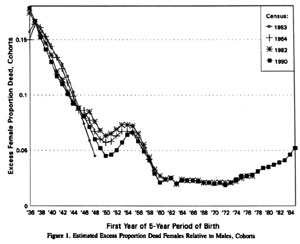
When the ratio of males to females recorded in a census is compared with the estimated normal ratio, one sees the extent to which the ratio in the census has been increased as a result of female mortality higher than normal in relation to male mortality. Indeed, it can be shown that the proportion of females absent as the result of excess female mortality (in relation to male) is equal to the recorded ratio of males to females divided by the sex ratio in the model, minus 1.0. Figure 1 displays the proportion of absent females estimated in this way in each census in each cohort, identified by the years of its birth.
Very close agreement exists among the estimated proportions of absent females within each cohort in the different censuses, as illustrated by the closely clustered lines in Figure 1. This tight agreement shows that the excess female mortality which caused a high ratio of males to females in a cohort had taken its toll by the first time a cohort was enumerated; almost all of the excess deaths occurred very early in life.
Figure 1 illustrates the evolution of excess female mortality as the time period of the birth of successive cohorts advanced. The midpoint (median) of the estimates of missing females from the different censuses is above 15% for the four earliest cohorts (1936-1940 to 1939-1943) and above 10% for the next five cohorts (until 1944-1948). A sharp decline continues, interrupted by higher proportions of missing females in cohorts who spent early childhood years during the crisis period of 1959-1961, when early-age female mortality apparently rose more sharply than male. The resumed downtrend led to ratios below 3% in the 1960s, and then to a level not far above 2%. A gradual increase began in the mid-1970s (after the cohort born 1972-1976); this increase grew steeper after cohorts born in 1974-1978.
Table 2. Model Sex Ratios for Cohorts at Censuses, by Years of Birth
Census
Years of Birth / 1953 / 1964 / 1982 / 1990
1936-1940 / 1.012 / 1.018 / 0.975 / 0.954
1937-1941 / 1.014 / 1.016 / 0.980 / 0.962
1938-1942 / 1.015 / 1.015 / 0.985 / 0.970
1939-1943 / 1.015 / 1.014 / 0.989 / 0.977
1940-1944 / 1.015 / 1.014 / 0.994 / 0.984
1941-1945 / 1.014 / 1.015 / 0.998 / 0.989
1942-1946 / 1.012 / 1.015 / 1.001 / 0.993
1943-1947 / 1.011 / 1.016 / 1.005 / 0.998
1944-1948 / 1.013 / 1.016 / 1.007 / 1.002
1945-1949 / 1.016 / 1.019 / 1.011 / 1.006
1946-1950 / 1.019 / 1.021 / 1.013 / 1.008
1947-1951 / 1.021 / 1.024 / 1.015 / 1.010
1948-1952 / 1.024 / 1.026 / 1.018 / 1.013
1949-1953 / -- / 1.028 / 1.020 / 1.015
1950-1954 / -- / 1.028 / 1.021 / 1.017
1951-1955 / -- / 1.028 / 1.021 / 1.017
1952-1956 / -- / 1.028 / 1.021 / 1.017
1953-1957 / -- / 1.028 / 1.022 / 1.018
1954-1958 / -- / 1.028 / 1.022 / 1.018
1955-1959 / -- / 1.028 / 1.022 / 1.018
1956-1960 / -- / 1.028 / 1.023 / 1.020
1957-1961 / -- / 1.029 / 1.025 / 1.022
1958-1962 / -- / 1.029 / 1.027 / 1.024
1959-1963 / -- / 1.029 / 1.028 / 1.026
1960-1964 / -- / -- / 1.028 / 1.028
1961-1965 / -- / -- / 1.029 / 1.029
1962-1966 / -- / -- / 1.030 / 1.030
1963-1967 / -- / -- / 1.032 / 1.032
1964-1968 / -- / -- / 1.033 / 1.033
1965-1969 / -- / -- / 1.035 / 1.035
1966-1970 / -- / -- / 1.036 / 1.036
1967-1971 / -- / -- / 1.037 / 1.037
1968-1972 / -- / -- / 1.038 / 1.038
1969-1973 / -- / -- / 1.039 / 1.039
1970-1974 / -- / -- / 1.040 / 1.040
1971-1975 / -- / -- / 1.040 / 1.040
1972-1976 / -- / -- / 1.040 / 1.040
1973-1977 / -- / -- / 1.040 / 1.040
1974-1978 / -- / -- / 1.040 / 1.040
1975-1979 / -- / -- / 1.040 / 1.040
1976-1980 / -- / -- / 1.041 / 1.041
1977-1981 / -- / -- / 1.043 / 1.043
1978-1982 / -- / -- / -- / 1.044
1979-1983 / -- / -- / -- / 1.045
1980-1984 / -- / -- / -- / 1.046
1981-1985 / -- / -- / -- / 1.046
1982-1986 / -- / -- / -- / 1.047
1983-1987 / -- / -- / -- / 1.047
1984-1988 / -- / -- / -- / 1.048
1985-1989 / -- / -- / -- / 1.048
First Year of 5-Year Period of Birth
Figure I. Estimated Excess Proportion Dead Females Relative to Males, Cohorts
DATA ON SEX RATIOS FROM THE FERTILITY SURVEYS
Two large-scale fertility surveys have been conducted in China, one in 1982 (the so-called one-per-thousand survey) and another in 1988 (the two-per-thousand survey). Both surveys asked a large sample of married women (311,000 age 15-67 in 1982, and 459,000 age 15-57 in 1988) for a lifetime history including each respondent's date of birth, her date of marriage, and the birth date of each child that she had borne. The respondents also were asked, with respect to each birth reported, whether the child had survived to the date of the survey.
The 1982 survey has provided invaluable information about the course of marriage and fertility in China, and has proved to be very consistent with relevant data taken from the 1982 census. For example, the age-specific fertility rates that have been tabulated for individual years after 1950 from the ratio of the reported number of births at each age to the number of women in that age in each year can be cumulated to determine the average number of children ever born to women at different ages in 1982. The 1982 census included a question about the number of children ever born. The average number by single years of age from 20 to 50 from the two sources agrees within 1%, a remarkable degree of consistency from two independent sources of information (Coale 1984).
Consistency is not certain proof of accuracy, however. It is surprising that the ratio of reported male to reported female births for individual past years was not virtually constant at about 1.06 male births for each female birth, as was surely true of the actual, rather than the reported, births." The sex ratio at birth in populations with accurate registration falls between about 1.05 and 1.07; notably it is usually within this range in data from China's neighbor Japan (Japan 1991).
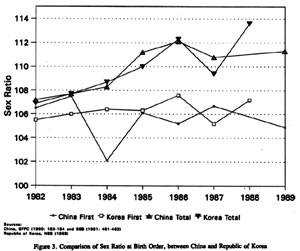
Table 3 shows the recorded sex ratio at birth from the two surveys by five-year birth cohorts, with births through 1981 from the one-per-thousand survey, for 1982-1987 from the two-per-thousand survey, and for 1989 from the sample tabulation of the 1990 census (the ratio for 1988 was taken as the average of 1987 and 1989). The ratio falls within the usual bounds for only three of 50 cohorts; the average is 1.091, about 3% above the expected norm.
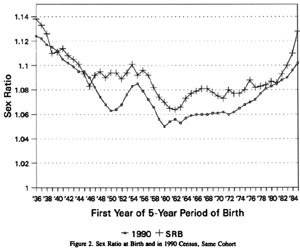
We see a striking congruence between the reported sex ratio by period of birth and the sex ratio reported for the same cohort in the 1990 census (Figure 2). Where masculinity is reported as especially high in 1990, the masculinity of the births reported in the retrospective fertility surveys for the same cohort is also generally high. As stated above in the discussion of the excess masculinity in the four modem censuses of China, the sex ratio of each excessively masculine cohort is too high in the first census in which it is enumerated; this finding indicates that the excess masculinity in the census is the result of excess female mortality and that the excess mortality occurs in infancy and childhood.
As shown by the similarity of time pattern between the sex ratio of the cohorts enumerated in the 1990 census and the reported sex ratio for the births in the years when these cohorts were born, the births of some of the females who were omitted in the censuses (evidently because an unusual proportion of the females were dead) were simply not reported in the fertility surveys. Thus, where the high masculinity in the census indicates excess female mortality, some of the females subject to excess mortality were omitted from the births reported in the fertility survey. The true sex ratio at birth was approximately constant until the mid 1980s when sex-selective abortion began to raise the true ratio. The true correlation between the sex ratio at birth of each cohort and the sex ratio in the 1990 census is about zero; the calculated correlation between these two sets of numbers is 0.91.
Table 3. Sex Ratios of Births Reported in Fertility Surveys, 1936-1940 to 1985-1989
Years of Birth / Sex Ratio / Years of Birth / Sex Ratio
1936-1940 / 1.138 / 1961-1965 / 1.065
1937-1941 / 1.133 / 1962-1966 / 1.064
1938-1942 / 1.126 / 1963-1967 / 1.066
1939-1943 / 1.110 / 1964-1968 / 1.073
1940-1944 / 1.111 / 1965-1969 / 1.077
1941-1945 / 1.114 / 1966-1970 / 1.079
1942-1946 / 1.108 / 1967-1971 / 1.081
1943-1947 / 1.105 / 1968-1972 / 1.081
1944-1948 / 1.101 / 1969-1973 / 1.078
1945-1949 / 1.093 / 1970-1974 / 1.075
1946-1950 / 1.083 / 1971-1975 / 1.073
1947-1951 / 1.092 / 1972-1976 / 1.080
1948-1952 / 1.095 / 1973-1977 / 1.077
1949-1953 / 1.090 / 1974-1978 / 1.077
1950-1954 / 1.094 / 1975-1979 / 1.080
1951-1955 / 1.094 / 1976-1980 / 1.088
1952-1956 / 1.089 / 1977-1981 / 1.082
1953-1957 / 1.094 / 1978-1982 / 1.083
1954-1958 / 1.101 / 1979-1983 / 1.084
1955-1959 / 1.092 / 1980-1984 / 1.087
1956-1960 / 1.096 / 1981-1985 / 1.086
1957-1961 / 1.092 / 1982-1986 / 1.093
1958-1962 / 1.082 / 1983-1987 / 1.100
1959-1963 / 1.074 / 1984-1988 / 1.110
1960-1964 / 1.070 / 1985-1989 / 1.128
First Year of 5-Year Period of Birth
-<>- 1990 + SRB
Figure 2. Sex Ratio at Birth and in 1990 Census, Same Cohort
Omission of females who died early in life from a fertility history is consistent with a tendency found in the registration of births and early deaths in some of China's neighbors. In registration systems in these countries, which are generally precise, the deaths that occur very early in life are underregistered. Even in Japan, which has unusually complete and accurate registration of births and deaths, the number of very early deaths is underrecorded. The proportion of deaths in the first year of life that occur on the first day is more than 30% in almost all of the countries with low infant mortality. The proportion registered is only 23% and 24% in two different years in Japan, and is less than 8% in Hong Kong. A revealing sign of bias is the ratio of registered stillbirths to registered deaths in the first day of life. In Hong Kong this ratio is over 6; in Japan, over 4; in most European and North American countries, about 2 to 2.5. In Japan and Hong Kong, the person registering births and deaths evidently does not follow the international recommendation of the World Health Organization to count as a live birth an issue from the womb that shows any signs of life after delivery-either respiration or pulse, for example. A stillbirth is to be registered only for a fetus that shows no such signs. From the much higher ratio of reported stillbirths to reported deaths in the first day of life in these populations, it is clear that the registering person sometimes counts as a stillbirth an event that would be counted in Europe as an early infant death.
In China the birth of a child traditionally is not celebrated until the child has reached an age of one month or more, and the child is not given a name until the passage of some such period of time. The basis for this custom apparently is a belief that celebrating a birth and giving a name soon after the birth tempts the fates to cancel the early celebration by the death of the child. Because this custom apparently causes a bias in otherwise accurate official registration of vital events, it is certainly likely that respondents who share this culture omit from a history of their births those which are followed shortly by the child's death.
Reported Sex Ratios at Birth, by Birth Order
One peculiar feature of the data from the fertility surveys has caused comment: the sex ratio at birth reported for higher-order births is higher than for the first or for the first and second. This feature indicates a higher rate of omission of higher-order female births because careful studies of the true relation between birth order and the sex ratio at birth in several reliable data bases indicate a very slight tendency toward lower masculinity at higher orders (Teitelbaum, Mantel & Stark 1971). China's one-per-thousand fertility survey called attention to the increase in sex ratio at birth with birth order reported for 1981, from a ratio of 1.05 for first births to respective ratios of 1.07, 1.13, and 1.16 at orders 2, 3, and 4; the Chinese report on the survey says that the reason for this trend remains to be found.
Through the generous cooperation of the East-West Population Institute in Honolulu, we were able to obtain data (from the full tape of the one-per-thousand fertility survey) bearing on the number of births by birth order and sex, in order to trace by birth cohort the relative reported sex ratios at birth of higher-order and lower-order births. Masculinity of reported births increased with birth order in the reports for earlier cohorts, as well as for those born just before the survey. The relevant information is contained in Table 4, which lists the ratio of male-to-female births in five-year periods from 1936-1940 to 1985-1989 for birth orders 1 and 2 and birth orders 3 and 4. 6 In all but a few cohorts, the sex ratio reported at birth for orders 3 and 4 is higher than for orders I and 2; the mean difference is 2%. Among first and second births, 12 of 50 cohorts have sex ratios within the expected limits of 1.05-1.07; for third and fourth births, only four cohorts fall within these limits.
As indicated by the congruence between the reported sex ratio at birth in the fertility surveys and for the same cohorts in the 1990 census, a high reported sex ratio at birth is evidence of excess female mortality in an early period after birth. The higher reported sex ratio at birth for third and fourth births in most cohorts implies a greater degree of excess early female mortality among higher order births.
Sex Ratios by Birth Order within Each Sex
Table 5 lists the reported ratio of first-male births in China to first-female births, second-male births to second-female births, and higher-than-second-order male births to higher-than-second-order female births. Note that the birth order discussed here is the order within the sex. It is not male births among first births and female births among first births, but births of first sons (whatever the absolute order of the birth) relative to births of first daughters, again without regard to overall order. A first son can be of any birth order (l, 2, 3, ... , n), depending on the presence of female births in the mother's sequence.
Table 4. Sex Ratio of Births Reported in Fertility Surveys, Birth Orders 1 and 2 and Birth Orders 3 and 4, 1936--1940 to 1985-1989
Period / Birth Orders 1-2 / Birth Orders 3-4
1936-1940 / 1.129 / 1.167
1937-1941 / 1.126 / 1.151
1938-1942 / 1.125 / 1.125
1939-1943 / 1.123 / 1.095
1940-1944 / 1.119 / 1.119
1941-1945 / 1.114 / 1.141
1942-1946 / 1.105 / 1.134
1943-1947 / I. 106 / 1.120
1944-1948 / 1.086 / 1.129
1945-1949 / 1.086 / 1.119
1946-1950 / 1.081 / 1.105
1947-1951 / 1.092 / 1.118
1948-1952 / 1.088 / 1.116
1949-1953 / 1.092 / 1.101
1950-1954 / 1.088 / 1.109
1951-1955 / 1.090 / 1.100
1952-1956 / 1.085 / 1.097
1953-1957 / 1.087 / 1.099
1954-1958 / 1.091 / 1.099
1955-1959 / 1.083 / 1.093
1956-1960 / 1.088 / 1.102
1957-1961 / 1.088 / 1.098
1958-1962 / 1.080 / 1.098
1959-1963 / 1.065 / 1.094
1960-1964 / 1.067 / 1.081
1961-1965 / 1.065 / 1.073
1962-1966 / 1.063 / 1.064
1963-1967 / 1.064 / 1.058
1964-1968 / 1.069 / 1.066
1965-1969 / 1.074 / 1.073
1966-1970 / 1.079 / 1.068
1967-1971 / 1.079 / 1.076
1968-1972 / 1.075 / 1.084
1969-1973 / 1.071 / 1.084
1970-1974 / 1.065 / 1.081
1971-1975 / 1.056 / 1.085
1972-1976 / 1.062 / 1.092
1973-1977 / 1.060 / 1.088
1974-1978 / 1.064 / 1.085
1975-1979 / 1.065 / 1.086
1976-1980 / 1.080 / 1.088
1977-1981 / 1.074 / 1.084
1978-1982 1.077 / 1.090
1979-1983 / 1.077 / 1.088
1980-1984 / 1.081 / 1.113
1981-1985 / 1.078 / 1.113
1982-1986 / 1.086 / 1.155
1983-1987 / 1.094 / 1.171
1984-1988 / 1.103 / 1.200
1985-1989 / 1.113 / 1.228
Table 5. Sex Ratio of Births Reported in 1/1000 Fertility Survey, Birth Order within Each Sex, 1936-1940 to 1977-1981
Ratio (Male Births/Female Births)
Period / Order 1 / Order 2 / Order 3
1936-1940 / 1.093 / 1.231 / 1.391
1937-1941 / 1.075 / 1.230 / 1.370
1938-1942 / 1.069 / 1.190 / 1.334
1939-1943 / 1.062 / 1.169 / 1.247
1940-1944 / 1.055 / 1.173 / 1.270
1941-1945 / 1.063 / 1.162 / 1.257
1942-1946 / 1.055 / 1.139 / 1.251
1943-1947 / 1.049 / 1.133 / 1.223
1944-1948 / 1.035 / 1.127 / 1.233
1945-1949 / 1.033 / 1.108 / 1:219
1946-1950 / 1.028 / 1.085 / 1.212
1947-1951 / 1.041 / 1.084 / 1.218
1948-1952 / 1.044 / 1.074 / 1.223
1949-1953 / 1.042 / 1.061 / 1.207
1950-1954 / 1.046 / 1.063 / 1.206
1951-1955 / 1.043 / 1.070 / 1.192
1952-1956 / 1.034 / 1.075 / 1.182
1953-1957 / 1.038 / 1.071 / 1.193
1954-1958 / 1.040 / 1.081 / 1.192
1955-1959 / 1.028 / 1.078 / 1.181
1956-1960 / 1.033 / 1.078 / 1.178
1957-1961 / 1.039 / 1.072 / 1.166
1958-1962 / 1.025 / 1.079 / 1.137
1959-1963 / 1.020 / 1.061 / 1.127
1960-1964 / 1.021 / 1.057 / 1.117
1961-1965 / 1.017 / 1.062 / 1.114
1962-1966 / 1.012 / 1.069 / 1.114
1963-1967 / 1.015 / 1.075 / 1.110
1964-1968 / 1.026 / 1.091 / 1.108
1965-1969 / 1.028 / 1.108 / 1.103
1966-1970 / 1.040 / 1.100 / 1.103
1967-1971 / 1.048 / 1.091 / 1.106
1968-1972 / 1.051 / 1.091 / 1.106
1969-1973 / 1.051 / 1.098 / 1.093
1970-1974 / 1.063 / 1.085 / 1.082
1971-1975 / 1.066 / 1.092 / 1.067
1972-1976 / 1.083 / 1.117 / 1.039
1973-1977 / 1.091 / 1.129 / 1.005
1974-1978 / 1.102 / 1.140 / 0.969
1975-1979 / 1.104 / 1.164 / 0.939
1976-1980 / 1.128 / 1.168 / 0.896
1977-1981 / 1.133 / 1.139 / 0.856
Until the mid-1960s, the ratio of reported male-to-female births by order within each sex rises as order increases. Among births reported in the 1940s and 1950s, the reported ratio of third-male to third-female births is 15 to 20% higher than the ratio of first males compared to first females.
The difference remains large until the 1970s and 1980s, when the sex ratio of first males to first females rises, and the ratio of third males to third females falls to substantially below 1. The anomalous "crossover" of these sex ratios at birth is discussed later.