3.1 GATHERING OF EVIDENCE
Similar to the investigation into the collapse of the WTC towers, data for WTC 7 were collected from a number of sources and reviewed. Much of the information on WTC 7 was gathered and published during the reconstruction of the collapses of the towers. Comparison of the various building codes in use at the time of construction was the subject of NIST NCSTAR 1-1E. Details of the fire safety provisions and systems were published in NIST NCSTAR reports 1-1D, 1-1G, 1-1I, 1-4B, 1-4C, and 1-4D. The emergency power systems were described in NIST NCSTAR 1-1J. Properties of the structural steels used in the construction were the subject of NIST NCSTAR 1-3D and NIST NCSTAR 1-3E. The SFRM properties were presented in NCSTAR 1-6A. Much of the activities of the emergency responders was reported in NIST NCSTAR 1-8. A description of the collection and cataloguing of the photographic and videographic evidence appeared in NIST NCSTAR 1-5A. This included visuals of debris impact damage and fire spread subsequent to collapse of the WTC towers. Additional imagery was collected subsequent to the previously reported library. While not as plentiful as the imagery for the WTC towers, the cumulative WTC 7 evidence was sufficient to guide the reconstruction of the day's events.
As with the WTC towers, much of the information specific to the WTC 7 building construction was lost with the destruction of the WTC site. Nonetheless, copious information was obtained from drawings and specifications, reports, and available records from The Port Authority, Silverstein Properties, and a number of contractors that had worked on the design, construction, or modifications of WTC 7. The documents included erection and fabrication shop drawings of the building, which provided detailed information about the floor and column connections. Information and documents regarding the layout of the building interior were obtained from WTC 7 tenants. Staff of the occupying organizations and Silverstein Properties staff were also interviewed to gain additional insights into the layout, furnishing, and overall fuel loads. Additional interviews with emergency responders and building officials, along with tapes of radio transmissions from September 11, 2001, provided accounts of the human activity inside the building and around the WTC site.
3.2 THE LEADING HYPOTHESIS
Based on observations and analyses of photographic and video records, critical study of steel framing, and simplified and detailed analyses to investigate possible failure modes that could lead to an initiating event, NIST developed the following collapse hypothesis:
• The conditions that led to the collapse of WTC 7 arose from fires, perhaps combined with structural damage that followed the impact of debris from the collapse of WTC I. The fires were fed by ordinary office combustibles.
• The fires on Floors 7 through 13 heated the building structure. Being lighter than the columns and with thinner SFRM, the floor beams, floor slabs, and connections heated more quickly and to higher temperatures than the columns. The elevated temperatures in the floor elements led to their thermal expansion, sagging, and weakening, which resulted in failure of floor connections and/or buckling of floor beams.
• Sufficient breakdown of connections and/or beams resulted in loss of lateral support and buckling of at least one of the critical columns supporting a large-span floor bay on the eastern side of the building on or below Floor 13. This was the initiating event of the collapse.
RICH BRAND CONDENSED: Stick It Where the Sun Don’t Shine (All Knuckles and Nails) (Enlightened Cannibal Series) by Tara Carreon
-- 9/11 Synthetic Terror Made in USA, by Webster Griffin Tarpley

• The initial local failure progressed upward to the east penthouse. As the large floor bays became unable to redistribute the loads, the interior structure below the east penthouse collapsed into WTC 7.
• Triggered by damage due to the falling debris and loss of lateral support to adjacent interior columns, the failure progressed westward in the region of Floors 7 through 14, where the floors had been weakened by fires. This ultimately resulted in the collapse of the entire structure.
The Investigation Team then proceeded to examine this hypothesis more closely and to consider possible alternative collapse initiating processes.
3.3 HYPOTHETICAL BLAST SCENARIOS
Considerable effort was expended to compile evidence and to determine whether intentionally set explosives might have caused the collapse of WTC 7 (NIST NCSTAR 1-9, Appendix D). As a minimum, the explosive material would have had to cause sufficient damage to a critical column or truss that it became unable to carry its service load or that a lateral deflection would cause it to buckle.
Six combinations of explosive location and column/truss sections and two implementation scenarios were considered. In the first scenario, there was ample time for optimized preparation of the structure (including possible preliminary cutting of structural members) and use of the minimum mass of explosives. In the second scenario, the explosive charge was to be placed in the shortest possible time, which was to be no more than a 7 h to 8 h time frame.
SHAMRC, a software program that is used for analysis of explosive detonations, shock propagation and structure loads due to blast and fragments, was used to simulate pressure histories from hypothetical blasts. The pressure histories were then used to determine whether windows would have broken, which would have provided visible evidence of a charge detonation to observers outside the building. SHAMRC has a proven record of accuracy for explosive weights of less than 500 g (1 lb) to more than 4 x 10[6] kg (4,000 tons). A validated Shard Fly-Out Model (SFOM) was used to predict window breakage. Simulations were performed for differing degrees of partitioning of a tenant floor.
Attention focused on a single hypothetical blast scenario. This scenario involved preliminary cutting of Column 79 and the use of 4 kg (9 lb) of RDX explosives in linear shaped charges. The other scenarios would have required more explosives, or were considered infeasible to accomplish without detection. Calculations were also performed for a lesser charge size of 1 kg (2 lb) to evaluate threshold explosive requirements for window fragility.
Preparations for a blast scenario would have been almost impossible to carry out on any floor in the building without detection. Preparations would have included removal of column enclosures or walls, weld torches to cut column sections, and placement of wires for detonation. Occupants, support staff, and visitors would have noticed such activities, particularly since they likely would have occurred around more than one column.
Figure 3-1 shows the results for the two shaped charges applied to Column 79 on a tenant floor that was highly partitioned, such as Floor 12. Nearly all the windows on the northeast section of the floor subjected to a blast would have been broken, even by the smaller charge. Simulations for a floor that was not highly partitioned led to more extensive window breakage.
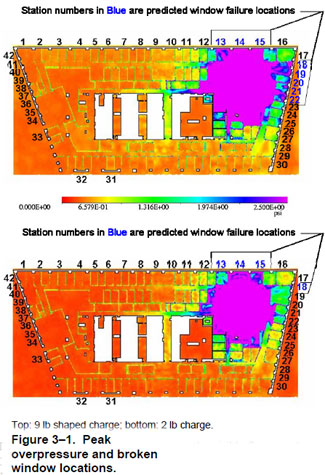
Top: 9 lb shaped charge; bottom: 2 lb charge.
Figure 3-1. Peak overpressure and broken window locations.
The actual window breakage pattern on the visible floors on September 11, 2001 (NIST NCSTAR 1-9, Chapter 5) was not at all like that expected from a blast that was even 20 percent of that needed to damage a critical column in WTC 7. The visual evidence did not show such a breakage pattern on any floor of WTC 7 as late as about 4:00 p.m. or above the 25th floor at the time of the building collapse initiation. Views of the northeast corner of WTC 7 at the time of the collapse were obstructed by other buildings.
The window breakage would have allowed the sound of a blast to propagate outward from the building. NLAWS, a validated acoustic wave propagation software program, was used to predict the propagation of the sound of the hypothetical blasts. The calculations showed that all the hypothetical blast scenarios and charge sizes would have broadcast significant sound levels from all of the building faces. For instance, if propagation were unobstructed by other buildings, the sound level emanating from the WTC 7 perimeter openings would have been approximately 130 dB to 140 dB at a distance of 1 km (0.6 mile) from WTC 7. This sound level is consistent with standing next to a jet plane engine and more than 10 times louder than being in front of the speakers at a rock concert. The sound from such a blast in an urban setting would have been reflected and channeled down streets with minimum attenuation. The hard building exteriors would have acted as nearly perfect reflectors, with little to no absorption. The sound would have been attenuated behind buildings, but this would also have generated multiple echoes. These echoes could have extended the time period over which the sound could have been detected and could possibly have had an additive effect if multiple in-phase reflections met. However, soundtracks from videos being recorded at the time of the collapse did not contain any sound as intense as would have accompanied such a blast (NIST NCSTAR 1-9, Chapter 5). Therefore, the Investigation Team concluded that there was no demolition-type blast that would have been intense enough to lead to the collapse of WTC 7 on September 11, 2001.
3.4 THE FOUR-STEP SIMULATION PROCESS
3.4.1 Technical Approach
To test the working hypothesis and to reconstruct the probable collapse sequence for WTC 7, the Investigation Team supplemented the information available from the photographic and videographic evidence, eyewitness accounts, and personal interviews with computer simulations. The analyses accounted for the debris-impact damage, the growth and spread of fires, the heating and thermal expansion and weakening of structural components, and the progression of local structural failures that led to the collapse of the building.
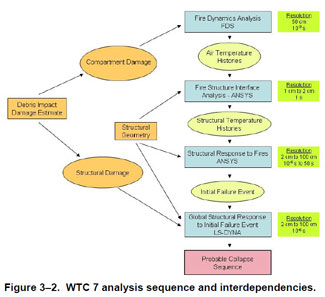
Figure 3-2 is a flow chart of the sequence and inter-dependencies of the analyses for the reconstruction of the WTC 7 collapse. Four models were used, as described in Sections 3.4.2 through 3.4.5.
Similar to the analyses conducted for the WTC towers, the analyses of WTC 7 continued to advance the current state of the art and tested the limits of computational capabilities. The unprecedented complexity and sophistication of these analyses required the use of various strategies for managing the computational demands while adequately capturing the essential physics of the problem. The uncertainties, the assumptions made, and the testing of these assumptions are documented in NIST NCSTAR 1-9. Beyond the assumptions that were considered in the collapse analysis of the WTC towers, four additional significant areas of uncertainty influenced the collapse analysis of WTC 7. These areas included fire growth and spread, debris impact damage due to the collapse of WTC 1, transitioning from the structural fire response to the collapse analysis, and the analysis progression from initiation to global collapse.
Figure 3-2. WTC 7 analysis sequence and interdependencies.
Fires Simulated
The visual evidence indicated that the only fires of significant duration and intensity were on Floors 7 through 9 and 11 through 13.
• By 1:00 p.m., there was no visual evidence that the small, early fires on Floors 19, 22, 29, and 30 were still burning (NIST NCSTAR 1-9, Chapter 5). Therefore, these fires were not included in the four-step analysis sequence.
• There was no confirmed evidence of fires on other floors of WTC 7. The layout of the other tenant spaces (Floors 15 and above) indicated that, had there been fires of the duration and intensity of those on Floors 7 through 9 and 11 through 13, they would have been recorded in at least some of the photographic images or videos.
• There were no signs of fires on the 5th and 6th mechanical floors. There was little combustible material on the 6th floor, making a sustained and intense fire unlikely.
Hypothetically, there might have been fires on the 5th floor, since external views of the interior of these floors were inhibited by air intake and exhaust plenums, louvers, and/or transformer vault walls on the north, east and west faces (Figure 3-3 and Figure 3-4, reproduced from NIST NCSTAR 1-9, Chapter 3). Therefore, NIST performed simulations of the potentially severe pool fires that might have resulted from ignition of spillage (e.g., from a ruptured fuel supply line) of the diesel fuel present on the 5th floor or that might have been pumped to that floor. Four types of fires resulting from fuel line rupture in the northeast section of the 5th floor were analyzed (NIST NCSTAR 1-9, Chapter 9).
• An over-ventilated fire, in which the fuel burning could have been sustained for approximately seven hours between the collapse of WTC 1 and the collapse of WTC 7. Result: The gas temperatures around all nine diesel generators would have quickly exceeded the generator operating limit, and there would have been no power to continue pumping fuel. Thus, the fire could not have been sustained.
• An over-ventilated fire, in which the burning rate was doubled, representing a higher intensity fire of shorter duration. Result: The fire could not have been sustained for the same reason as in the previous case.
• An under-ventilated fire, in which the air handling system was turned off and the louvers were closed. The initial fuel burning rate was fit to the air availability. Result: The sustained air temperatures were not high enough to compromise the structure.
• An under-ventilated fire, in which the air handling system was turned off, but the louvers were open. Result: Smoke would have exhausted through the east louvers, and the imagery showed no such effluent.
An additional simulation was performed of an over-ventilated fire near the breach in the south wall. Result: The fire might have been able to damage the nearby columns, especially if their thermal insulation had been damaged by the debris from WTC 1. However, as will be seen later, the collapse of WTC 7 originated on the east side of the building, and there was no path for the hot gases to reach and weaken the structure on that side.
The diesel fuel in the day tank on Floor 5 was only equivalent to a few percent of the combustible furnishings on a tenant floor. It was unlikely that the tank would have been re-supplied because of multiple safeguards in the fuel delivery system.
NIST determined that a spray fire of the diesel fuel would have been less damaging than a pool fire, even though the spray fire temperature would have been a few hundred degrees higher. A fuel spray would have resulted from a small leak in the fuel supply piping, so the fuel escape rate would have been far less than in the over-ventilated pool fire scenarios. Had this small building spray hit Column 79 directly, it would only have heated a small area of the column. NIST calculations (NIST NCSTAR 1-9. Chapter 4) showed that even if the entire column had been immersed in a 1400 °C (2550 °F) flame, it would have taken 6 h to heat the column to the point of significant loss of strength and stiffness.
NIST also evaluated the possible contribution of diesel fuel from the day tanks on Floors 7 and 9 to the fires on those floors. The amount of fuel available within the day tanks was insignificant compared to the mass of other combustibles on those floors. Nearly all the diesel fuel in the tanks that supplied the day tank on the 9th floor was recovered months after the WTC 7 collapse. The diesel fuel could have contributed to the initial ignition and spread of the fire on the south side of Floor 7 and on the west side of Floor 9, but these fires would have been far removed from the critical structural systems on the east side of WTC 7.
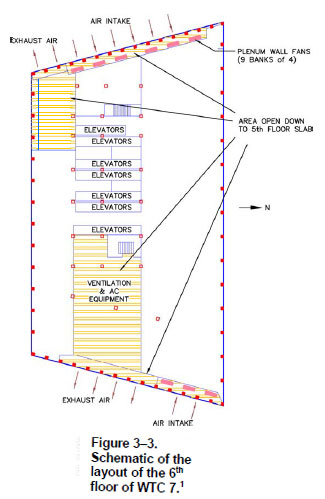
Figure 3-3. Schematic of the layout of the 6th floor of WTC 7. [1]
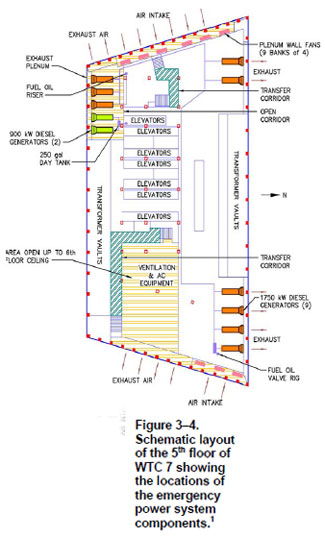
Figure 3-4. Schematic layout of the 5th floor of WTC 7 showing the locations of the emergency power system components. [1]
Based on these analyses and review of the numerous interview transcripts [2], NIST concluded that it was highly unlikely that any fires on the 5th or 6th floors contributed to the collapse of WTC 7.
NIST concluded that the only fires that could have led to structural weakening of WTC 7 were those on the 7th through 9th and 11th through 13th floors.
3.4.3 Fire Dynamics Simulator (FDS)
The major fires on Floors 7 through 9 and 11 though 13 in WTC 7 were simulated using the Fire Dynamics Simulator (FDS), version 4, in a manner similar to the simulations conducted for WTC 1 and WTC 2 (NIST NCSTAR 1-5F). There were far fewer photographs and videos of WTC 7 than of the towers; and, thus, the details of the WTC 7 fires were not as precise as for the fires in the towers. However, the imagery was sufficient to guide the WTC 7 fire simulations. Unlike the computations for WTC 1 and WTC 2, the fire simulations for WTC 7 were conducted for each floor individually, as there were no obvious pathways for the flames and heat to pass from one floor to another, aside from the debris-damaged area in the southwest corner of the building (NIST NCSTAR 1-9, Chapter 9). The fires on Floors 7, 8, and 12 were simulated using input from the visual imagery and established fire physics. The fire on Floor 9 was similar to that on Floor 8, and the simulation was derived from it. For the same reason, the fires on Floors 11 and 13 were derived from the fire on Floor 12. While use was made of the appearance of flames and window breakage in photographs and videos in formulating the simulations, the Investigation Team realized that the absolute timing of the simulations might not align exactly with the timing of the fires on September 11, 2001. A typical single floor fire simulation took up to two days on a Linux cluster with 8 processors.
Figure 3-5 shows hourly snapshots of the computed temperatures near the ceiling of the 8th floor. The general clockwise movement of the fires is in agreement with the visual images. Figure 3-6 is a similar visualization of the temperatures resulting from the computed fires on the 12th floor. The general counterclockwise movement of the fires is evident.
3.4.4 Fire Structure Interface (FSI)
The Fire Structure Interface (FSI) was used to impose the gas temperatures from the FDS simulations on the structural components of WTC 7 to predict the evolving thermal state of the building (NIST NCSTAR 1-9, Chapter 10). The thermal analysis approach was similar to that used to simulate the fire induced thermal loads on WTC 1 and WTC 2 described in NCSTAR 1-5G. The FDS temperature data for use in the structural analysis were sampled at 30 min intervals. For each time step, a set of thermal data files was generated that specified the thermal state of the lower 16 stories of the building. Three different thermal response computations were used. Case A used the temperature data as obtained from the FDS simulation. Case B increased the Case A gas temperatures by 10 percent and Case C decreased the Case A gas temperatures by 10 percent. Given the limited visual evidence, the Investigation Team estimated, using engineering judgment, that a 10 percent change in temperatures was within the range of reasonable and realistic values for the fires in WTC 7 on September 11, 2001. The computational time for each Case was approximately one to two days on a single processor desktop computer.
Figure 3-7 shows the calculated heating of the structural steel on the lower 16 floors of WTC 7 for the Case B temperatures from the fire simulation. The floor slabs have been removed from the figure for clarity. Figure 3- 8 is a typical rendition of the calculated heating of the top of a floor slab as a result of the Case 8 fire.
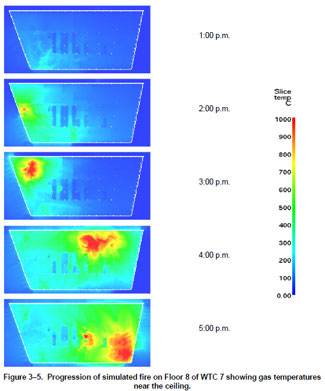
Figure 3-5. Progression of simulated fire on Floor 8 of WTC 7 showing gas temperatures near the ceiling.
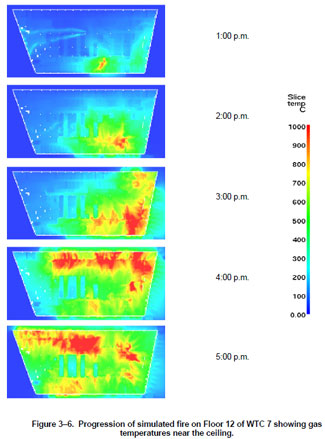
Figure 3-6. Progression of simulated fire on Floor 12 of WTC 7 showing gas temperatures near the ceiling.
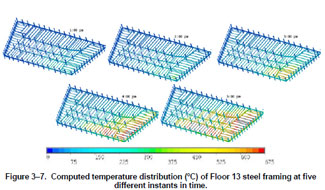
Figure 3-7. Computed temperature distribution (°C) of Floor 13 steel framing at five different instants in time.
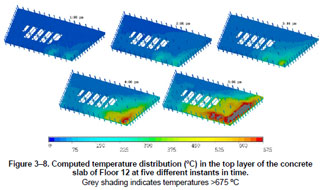
Figure 3-8. Computed temperature distribution (°C) in the top layer of the concrete slab of Floor 12 at five different instants in time.
Grey shading indicates temperatures >675 °C
3.4.5 Structural Analysis of the Initial Failure Event using ANSYS
The structural response of the lower 16 stories of WTC 7 to the heating from the fires on Floors 7 through 9 and 11 through 13 was simulated using ANSYS, a finite element computational model that allowed including the temperature-varying properties of the structural materials. This analysis was used to determine the sequence of events that led to the collapse initiation (NIST NCSTAR 1-9, Chapter 11). In addition to the temperature-time histories from the FSI results, the structural model used temperature- dependent mechanical properties of the steels, welds, and bolts used in the construction of WTC 7, including elastic, plastic, and creep properties. The description of the building structure was based on architectural and structural drawings of the original building and subsequent building alterations, as well as erection and shop fabrication drawings.
Component structural analyses were conducted to identify critical behavior and failure mechanisms that could have contributed to the global structural response of the building. These component analyses included (1) buckling of a core column, (2) beam-to-girder connections under thermal loading, and (3) girder-to-column connections under thermal loading. Subsystem analyses were then performed that incorporated the behavior and failure mechanisms identified in the component studies. The subsystems analyses included (1) the northeast corner of a typical floor and (2) a full tenant floor, both under gravity and fire loads. Modifications were made to reduce the model size and complexity and to enhance computational performance, but without adversely affecting the accuracy of the results. Whenever modeling modifications were used, they were validated against the detailed component model results.
Due to the nonlinearities in the analysis, as well as fire-induced damage, a 30 min analysis could take a few weeks to complete. Due to the range of time steps that were required to reach equilibrium (e.g., from 10-6 seconds to 10s of seconds), a complete ANSYS analysis for a given thermal case took approximately six months to complete on a 64 bit workstation with quad-core, 3.0 gigahertz (GHz) processor, and 64 gigabyte (GB) of Random Access Memory (RAM). The use of user-defined elements prevented the use of parallel processing on a Linux cluster.
The three different thermal response cases (A, B, and C) were used in the ANSYS analysis. Based on the ANSYS model results, it became apparent that the calculated fire-induced damage to connections and beams were occurring at essentially the same locations and with similar failure mechanisms, but shifted in time. (Case C failures occurred at a later time than the same failures in Case A, and Case A failures occurred at a later time than Case B failures.) As a result, only the fire-induced damage produced by Case B temperatures was carried forward as the initial condition for the building collapse analysis, since the damage occurred in the least computational time (i.e., 6 months).
Figure 3-9 shows an example of the extent of structural damage from the fires, in this case for the 13th floor. At both 3.5 h and 4.0 h, connections, floor beams, and girders were damaged or had failed at steel temperatures that were approximately 400 °C (750 °F) or less, primarily due to the effects of thermal expansion. After 4.0 h of heating, there was substantially more damage and failures in the WTC 7 structural floor systems than at 3.5 h of heating.
The ANSYS results were input to the LS-DYNA analysis when it appeared that an initial failure event might be imminent. Damage diagrams for the 16 floors modeled in ANSYS, such as those shown in Figure 3-9, indicated some degree of uncertainty in selecting the time and damage state for the transition. However, it appeared likely the critical damage state occurred between 3.5 h and 4 h. Accordingly, as shown in the next section, LS-DYNA analyses were performed for both of these damage states.
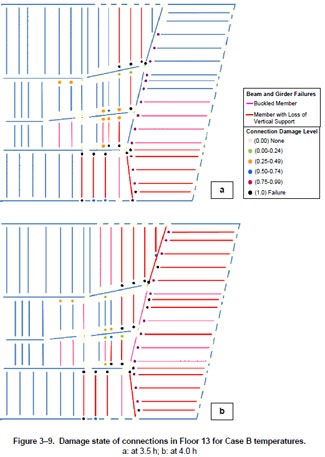
Figure 3-9. Damage state of connections in Floor 13 for Case B temperatures. a: at 3.5 h; b: at 4.0 h
3.4.6 Global Collapse Analysis using LS-DYNA
A global finite element model of the WTC 7 building was developed in LS-DYNA to study its structural response to an initial failure event due to fire and to determine the sequence of events that led to collapse propagation and, ultimately, global collapse. LS-DYNA was capable of explicitly modeling failures, falling debris, and debris impact on other structural components. It could also model nonlinear and dynamic processes, including nonlinear material properties, nonlinear geometric deformations, material failures, contact between the collapsing structural components, and element erosion based on a defined failure criterion. In addition, LS-DYNA had capabilities to include thermal expansion and softening of materials. (For more detail, see NIST NCSTAR 1-9, Chapter 12, and NIST NCSTAR 1-9A.)
The description of the building structure was based on architectural and structural drawings of the original building and subsequent building alterations, as well as erection and shop fabrication drawings. Other input data required by the global LS-DYNA model were presented in the following sections of NIST NCSTAR 1-9:
• Extent of damage to the building by debris impact from the collapse of WTC 1 (Chapter 5).
• Temperature-dependent mechanical properties of steel (Appendix E) and concrete (NIST NCSTAR 1-6A) used in the construction of WTC 7.
• Fire-induced damage to floor beams, girders, and their connections from the 16 story ANSYS analysis (Chapter 11).
• Temperatures for structural components and connections, at the time the ANSYS analysis transferred data to the LS-DYNA analysis (Chapter 10).
Due to the nonlinearities in the analysis, as well as sequential local failures, a 25 s analysis took up to 8 weeks to complete. The analyses were run on a Linux cluster with a head node with two 64 bit, 2.4 GHz processors and 4 GB of RAM and eight compute nodes with two 64 bit, 2.6 GHz processors. Six of the compute nodes had 8 GB of RAM and the remaining two nodes had 16 GB RAM.
Four simulations were performed with the global LS-DYNA model.
• The first was based on NIST's best estimate of both the debris impact damage from WTC 1 and the fire-induced damage as developed using the ANSYS modeling. This occurred at 4 h in the ANSYS computation.
• The second simulation differed only in the input of a lesser degree of fire-induced damage, which occurred at 3.5 h in the ANSYS computation. The purpose of this LS-DYNA simulation was to determine whether a lesser degree of fire-induced damage could lead to the collapse of WTC 7.
• The third simulation was the same as the first, except that no debris impact damage was included. The purpose of this analysis was to determine the contribution of debris impact to the WTC 7 global collapse sequence and whether WTC 7 would have collapsed solely due to the effects of the fires.
• In the fourth simulation, the building experienced no debris or fire-induced damage. A section of Column 79 between Floors 11 and 13 was removed. The purpose of this analysis was to determine the potential for a classic progressive collapse, i.e., disproportionate structural damage from a single failure, regardless of the cause of that failure.
The LS-DYNA model was initiated as follows to minimize any spurious dynamic effects associated with the loading sequence. First, gravity was applied slowly to the 47 floor structure, taking 4.5 s of elapsed simulation time. Then, the debris impact damage from the collapse of WTC 1 was applied to the structure instantaneously by removing from the model the damaged elements that were no longer capable of bearing their loads. The structure was then allowed to damp residual vibrations for 2 s. Over the next 2 s, the structural temperatures were ramped up to the levels from the ANSYS simulation. Last, the fire-induced damage obtained from the 16 story ANSYS analysis, including damage to floor beams, girders, and connections, was applied instantaneously. The damage was from the computation of Case B at 4 h after the initiation of the fires in FDS. The heated, damaged structure was then free to react. The time at which the east penthouse began to descend was defined as 0.0 s, i.e., the beginning of the collapse of WTC 7.
Figure 2-2 shows the structural response of WTC 7 to the fire-induced damage on the east side. Floor 13 collapsed onto the floors below, causing a cascade of floor failures down to Floor 5. The floor failures left Column 79 laterally unsupported and it buckled, which was quickly followed by the buckling of Columns 80 and 81. The buckling of Column 79 was the initiating event that led to the collapse of WTC 7, not the floor failures. If Column 79 had not buckled, due to a larger section or bracing, for instance, the floor failures would not have been sufficient to initiate a progression of failure that would result in global collapse.
The global analysis with fire-induced damage at 4.0 h most closely matched the observed collapse events, and the following discussion begins with the results from this analysis.
Figure 3-10 through Figure 3-14 depict the state of the WTC 7 structure at various times as the structure collapsed. The first four figures are views of the lowest 18 floors of the WTC 7 building core from the south. In these graphics, the exterior columns and some of the tenant floor structure spanning between the core and the exterior have been removed for an unobstructed view of the core. The scale on the right side shows the absolute (i.e., without any indication of direction) lateral displacement of each structural element. Displacements greater than 0.15 m (6 in.) are also shown in red.
Figure 3-10 shows the beginning of upper floor failures on the east side of the building at 0.5 s, following the buckling of Columns 79, 80, and 81. The east penthouse, which was supported by these three columns, had just begun to descend. About 2 s later, as shown in Figure 3-11 , the collapse of all the east sections of all the floors had occurred, the upper floors had moved southward, Truss 2 had been damaged, and the westward progression of the building failure was underway. Figure 3-12 and Figure 3-13, only 2 s apart, indicate the speed with which the westward column failures proceeded between Floors 7 and 14.
In Figure 3-14, the total collapse of the building is underway. The two views cover the lower half of the building. The purple area at the bottom is the Con Edison substation. With no fires on the west side of Floors 10 through 14, the intact floor framing pulled the exterior columns inward as the interior columns fell downward. Loads from the buckled interior columns were redistributed to the exterior columns, which, in turn, buckled the exterior columns between Floors 7 and 14 within approximately 2 s. At that point, the entire building above the buckled-column region moved downward as a single unit, resulting in the global collapse of WTC 7.
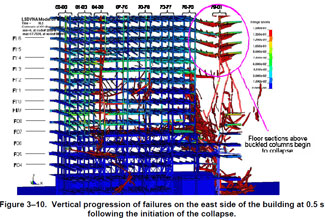
Figure 3-10. Vertical progression of failures on the east side of the building at 0.5 s following the initiation of the collapse.
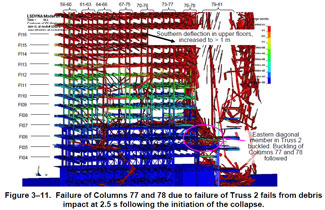
Figure 3-11. Failure of Columns 77 and 78 due to failure of Truss 2 fails from debris impact at 2.5 s following the initiation of the collapse.
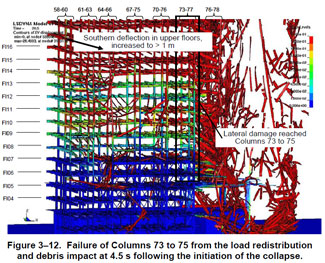
Figure 3-12. Failure of Columns 73 to 75 from the load redistribution and debris impact at 4.5 s following the initiation of the collapse.
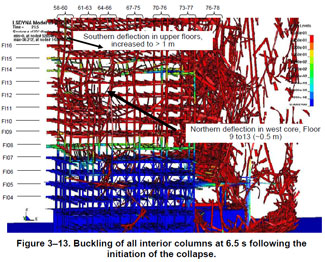
Figure 3-13. Buckling of all interior columns at 6.5 s following the initiation of the collapse.
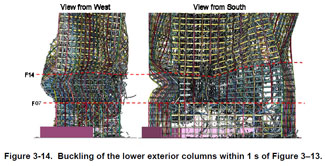
Figure 3-14. Buckling of the lower exterior columns within 1 s of Figure 3-13.
The second LS-DYNA analysis (lesser degree of fire-induced damage) did not lead to a collapse-initiating event, despite the extensive damage shown in Figure 3-9a.
The third LS-DYNA analysis demonstrated that the fire-induced damage led to the collapse of WTC 7, even without any structural damage from the debris impact. However, the mechanism of the collapse differed from the first analysis. This is discussed further in the next section.
The fourth LS-DYNA analysis showed that, following the removal of Column 79 between Floors 11 and 13, vertical and horizontal progression of failure occurred. This was followed by downward movement at the roofline due to buckling of exterior columns, which led to the collapse of the entire building. This analysis showed that WTC 7 was prone to classic progressive collapse associated with the local failure of Column 79.
3.5 ACCURACY OF THE PROBABLE COLLAPSE SEQUENCE
Independent assessment of the validity of the key steps in the collapse of WTC 7 was a challenging task. Some of the photographic information had been used to direct the simulations. For example, the timing of the appearance of broken windows was an input to the fire growth modeling. However, there were significant observables that were usable as corroborating evidence, as shown in Table 3-1 . The "Observation Times" were determined from examinations of photographs and videos shot on September 11, 2001. The times in the second and third columns are from the two global analyses with and without debris impact damage for Case B temperatures at 4.0 h. Time "zero" was set as the start of the descent of the east penthouse.
3.5.1 Aspects prior to the Global Collapse
Analysis of a video shot prior to and during the collapse showed an east-west vibration of the building prior to its collapse (NIST NCSTAR 1-9, Chapter 5 and Appendix C). The horizontal motion (± 2 in.) began 6 s before the east penthouse began to move downward. The horizontal building motion started at nearly the same time as the cascading floor failures started in the LS-DYNA analysis (-6.5 s), winch preceded the buckling failure of Colulmn 79. A seismic signal approximately 10 s prior to the onset of collapse was likely due to the falling of debris from the collapse (NIST NCSTAR 1-9 Appendix 8 ). It is consistent that the falling debris (on the east side of the building) imparted some momentum in the east west direction as it descended.
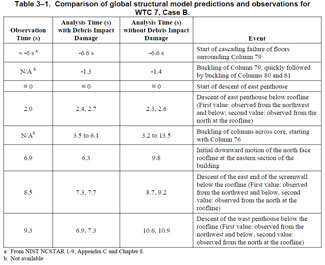
Table 3-1. Comparison of global structural model predictions and observations for WTC 7, Case B
The two calculated times and the observed time for the descent of the east penthouse below the roofline were quite similar, independent of the debris impact damage. At this point, the two computations were also similar to each other in the manner in which the vertical progression of the collapse was proceeding.
The horizontal progression of buckling core columns was interior to the building and could not have been observed from the street. The process occurred over a longer duration of 10.3 s (13.5 s minus 3.2 s) for the analysis without debris impact damage than for the duration of 2.6 s (6.1 s minus 3.5 s) for the analysis with impact damage. In the analysis without debris impact damage, the lack of core framing damage on the lower west side resulted in a sequence of interior column failures from east to west that occurred at a more uniform rate. In the analysis with debris impact damage, the core framing damage on the west side resulted in a more rapid failure of the west interior columns in the last stages of the horizontal progression.
The initial downward movement of the north face from the northeast corner to the east side of the screenwall was observed at 6.9 s after the initial downward motion of the east penthouse. The LS-DYNA analyses with and without impact damage bracketed that value.
3.5.2 Aspects following the Global Collapse Initiation
Once simulation of the global collapse of WTC 7 was underway, there was a great increase in the uncertainty in the progression of the collapse sequence, due to the random nature of the interaction, break up, disintegration, and falling debris. The uncertainties deriving from these random processes increasingly influenced the deterministic physics-based collapse process, and the details of the progression of the horizontal failure and final global collapse were increasingly less precise.
Thus, while the two predictions of the time of descent of the west penthouse also straddled the observed time, the mechanisms of building collapse were quite different. In the analysis without debris impact damage, the exterior columns buckled near mid-height of the building, approximately between Floors 17 and 29. In the analysis with debris impact damage, the exterior columns buckled between Floors 7 to 14, due to the influence of the exterior damage near the southwest corner. In both analyses, the eastern exterior wall deflected inward at the roof level as the structure became unsupported after the vertical collapse event. The western wall also deflected inward in the analysis without debris impact damage, as it was pulled inward as the last line of core columns failed.
There was another observable feature that occurred after the global collapse was underway. After the exterior facade began to fall downward at 6.9 s, the north face developed a line or "kink" near the end of the core at Column 76. As shown in Figure 5-205, the northeast corner began to displace to the north at about 8.8 s, and the kink was visible at 9.3 s. The kink in the north face and rotation of the northeast facade occurred 2 s to 3 s after the exterior facade had begun to move downward, as a result of the global collapse. The simulations do show the formation of the kink, but any subsequent movement of the building is beyond the reliability of the physics in the model.
3.5.3 Accuracy Appraisal
Given the complexity of the modeled behavior, the global collapse analyses matched the observed behavior reasonably well. The close similarity of the timing and the nature of the events up to the initiation of global collapse is strong confirmation of the extent and nature of the structural failures in the interior of the building and the accuracy of the four-step simulation process. The overall simulation of the collapsing building with damage better matched the video observations of the global collapse. The global collapse analysis confirmed the leading collapse hypothesis, which was based on the available evidence.
3.6 TIMING OF COLLAPSE INITIATION AND PROGRESSION
The timing of global collapse of WTC 7, as indicated by downward motion of the north exterior face, was investigated using a video of the collapse taken from the vantage point of West Street near Harrison Street (Camera No. 3, Figure 5-183 of NIST NCSTAR 1-9). An initial analysis compared the observed time it took for the roofline to fall approximately 18 stories to the free fall time under the force of gravity. A more detailed analysis examined the vertical displacement, velocity, and acceleration through different stages of the collapse process. (NIST NCSTAR 1-9, Chapter 12)
The time that the roofline took to fall 18 stories or 73.8 m (242 ft) was approximately 5.4 s. The theoretical time for free fall (i.e., at gravitational acceleration) was computed from t = square√ 2h/g.

where t = time, s: h = distance, m (ft); and g = gravitational acceleration, 9.81 m/s[2] (32.2 ft/s[2]). This time was approximately 3.9 s. Thus, the average time for the upper 18 stories to collapse, based on video evidence, was approximately 40 percent longer than the computed free fall time.
A more detailed examination of the same video led to a better understanding of the vertical motion of the building in the first several seconds of descent. NIST tracked the downward displacement of a point near the center of the roofline, fitting the data using a smooth function. [3] (The time at which motion of the roofline was first perceived was taken as time zero.) The fitted displacement function was then differentiated to estimate the downward velocity as a function of time, shown as a solid curve in Figure 3- 15. Velocity data points (solid circles) were also determined from the displacement data using a central difference approximation. [4] The slope of the velocity curve is approximately constant between about 1.75 s and 4.0 s, and a good straight line fit to the points in this range (open-circles in Figure 3-15) allowed estimation of a constant downward acceleration during this time interval. This acceleration was 32.2 ft/s[2] (9.81 m/s[2]), equivalent to the acceleration of gravity g.
For discussion purposes, three stages were defined, as denoted in Figure 3-15:
• In Stage 1, the descent was slow and the acceleration was less than that of gravity. This stage corresponds to the initial buckling of the exterior columns in the lower stories of the north face. By 1.75 s, the north face had descended approximately 2.2 m (7 ft).
• In Stage 2, the north face descended at gravitational acceleration, as the buckled columns provided negligible support to the upper portion of the north face. This free fall drop continued for approximately 8 stories or 32.0 m (105 ft), the distance traveled between times t = 1.75 s and t =4.0s.
• In Stage 3, the acceleration decreased somewhat as the upper portion of the north face encountered increased resistance from the collapsed structure and the debris pile below. Between 4.0 s and 5.4 s, the north face corner fell an additional 39.6 m (130 ft).
As noted above, the collapse time was approximately 40 percent longer than that of free fall for the first 18 stories of descent. The detailed analysis shows that this increase in time is due primarily to Stage 1. The three stages of collapse progression described above are consistent with the results of the global collapse analyses discussed in Chapter 12 of NIST NCSTAR 1-9.
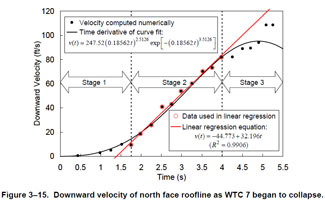
Figure 3-15. Downward velocity of north face roofline as WTC 7 began to collapse.
3.7 REFERENCES
Cantor 1985. Irwin G. Cantor P.C., Structural Engineers, Structural Drawings, 7 World Trade Center.
Flack and Kurtz 1988. Flack and Kurtz Mechanical Engineers, Mechanical and Electrical Drawings for Salomon Brothers 7 World Trade Center Headquarters.
Roth 1985. Emery Roth & Sons P.C., Architects, Architectural Drawings, 7 World Trade Center.
Syska & Hennessy 1985. Syska & Hennessy Engineers, Mechanical, Electrical, and Plumbing Drawings, 7 World Trade Center.
_______________
Notes:
1. The descriptions of the 5th and 6th floors were derived from architectural and mechanical design drawings provided by Emery Roth & Sons (Roth 1985), Irwin, Cantor (Cantor 1985), Syska & Hennessy (1985), and Flack & Kurtz (1988). Some of the details may differ from the actual layout on September 11, 2001.
2. For instance, sometime after 1:00 p.m., OEM and FDNY staff climbed the east stairway of WTC 7 and did not see much damage on the 4th, 5th, or 6th floors from their viewing location. They made no mention of fire, heat or smoke.
3 A function of the form
 was assumed, which satisfies the initial conditions of zero displacement, zero velocity, and zero acceleration. The constants A,
  , and k were determined using least squares fitting.
4 The central difference approximation is given by
 where z[1] and z[i+1] denote the displacement at time t[1] and t[i+1] respectively.