Re: HOUSEHOLD WEALTH TRENDS IN THE UNITED STATES, 1962-2013:
10. Summary and concluding remarks
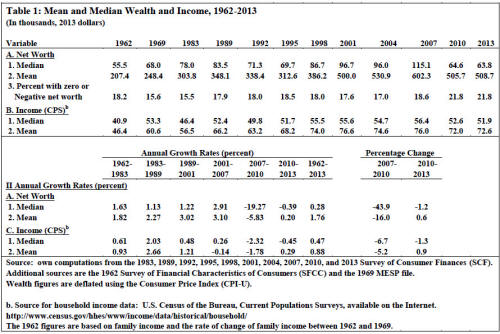
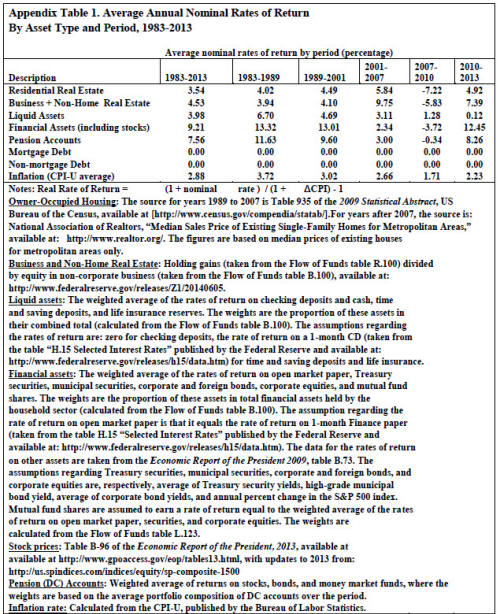
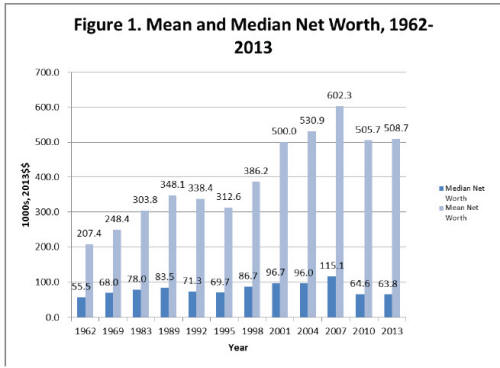
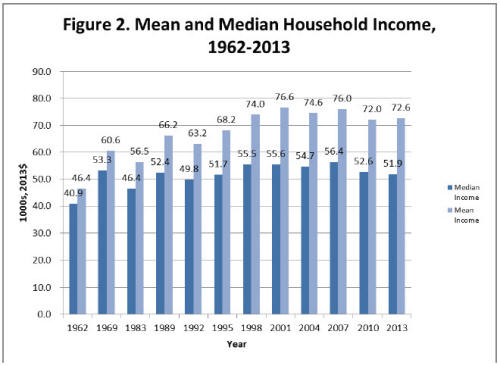
After a period of robust growth, median wealth continued to climb by 19 percent from 2001 to 2007, even faster than during the 1990s (and 1980s). Median income, on the other hand, rose only 1.6 percent. Then the Great Recession hit. From 2007 to 2010, house prices fell by 24 percent in real terms, stock prices by 26 percent, and median wealth by a staggering 44 percent. Median income also dropped but by a more modest 6.7 percent and median non-home wealth plummeted by 49 percent. The share of households with zero or negative net worth rose sharply from 18.6 to 21.8 percent.
However, from 2010 to 2013, asset prices recovered with stock prices up by 39 percent and house prices by 8 percent. Despite this, both median and mean wealth stagnated, while median income was down by 1.3 percent but mean income rose by 0.9 percent. The percent of households with zero or negative net worth remained unchanged.
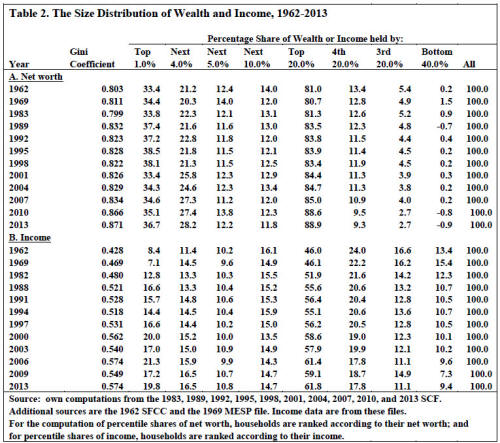
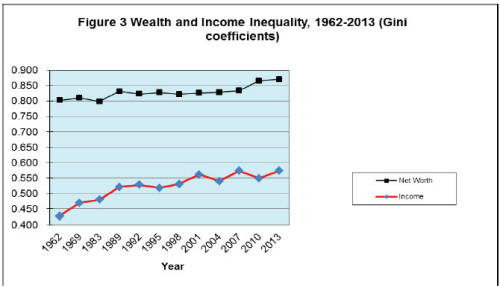
Wealth inequality after remaining relatively stable from 1989 to 2007 showed a steep advance over years 2007 to 2010. The Gini coefficient climbed from 0.834 to 0.866 and the share of the top 20 percent from 85 to 89 percent. In contrast, income inequality, after rising moderately from 2000 to 2007 (an increase of 0.12 Gini points), dropped substantially from 2006 to 2009 (a decrease of 0.25 Gini points). Net worth inequality, on the other hand, remained relatively unchanged between 2010 and 2013, though the share of the top one percent was up by 1.6 percentage points. But income inequality showed a substantial rise from 2010 to 2013, with the Gini coefficient returning to its 2007 level.
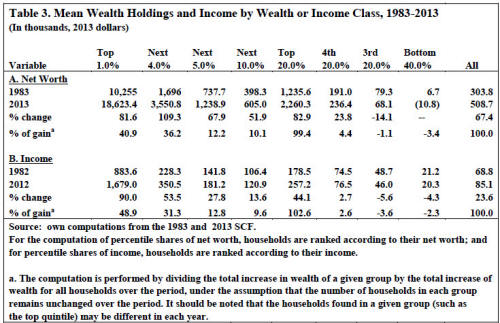
Between 1983 and 2013, the top one percent received 41 percent of the total growth in net worth, 43 percent of the total growth in non-home wealth, and 49 percent of the total increase in income. The figures for the top 20 percent are 99 percent, 98 percent, and 103 percent, respectively – that is to say, the upper quintile got it all!
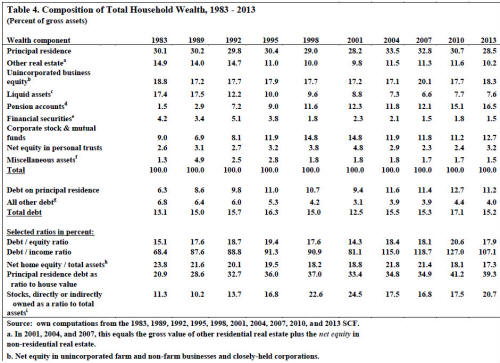
Another notable development was the sharply rising debt to income ratio during the early and mid 2000s, reaching its highest level in almost 25 years, at 119% among all households in 2007. The debt-equity ratio was also way up, from 14.3 percent in 2001 to 18.1 percent in 2007. Most of the rising debt was from increased mortgages on homes. From 2007 to 2010 both ratios continued to rise, the former moderately from 119 to 127 percent and the latter more steeply from 18.1 to 20.6 percent. This was true despite a moderate retrenchment of overall average debt of 4.4 percent and reflected the drop in both mean wealth and income. Both ratios fell off sharply by 2013, to 107 percent and 17.9 percent, respectively, as outstanding debt continued to shrink, by 13 percent in this case.
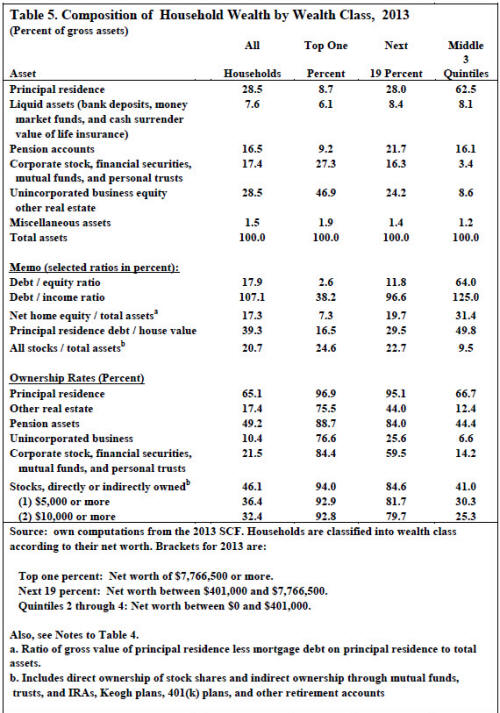
Home values as a share of total assets among all households remained relatively unchanged from 1983 to 2010 (around 30 percent). However, net equity in owner-occupied housing as a share of total assets fell from 24 percent in 1983 to 17 percent in 2010, reflecting rising mortgage debt on homeowner's property, which grew from 21 to 39 percent in 2013. The large increase in the ratio from 2007 to 2010 was a result of falling home values (average mortgage debt actually declined by 5.0 percent in constant dollars). The decline from 2010 to 2013 reflected a substantial reduction in average outstanding mortgage debt (13 percent).
Among the middle class (defined here by the middle three wealth quintiles) there was a huge increase in the debt-income ratio from 100 to 157 percent from 2001 to 2007 and of the debt-equity ratio from 46 to 61 percent. The debt-equity ratio was also much higher among the middle 60 percent of households in 2007, at 0.61, than among the top one percent (0.028) or the next 19 percent (0.121). However, from 2007 to 2010, while the debt-equity ratio continued to advance to 69 percent, the debt to income ratio actually fell off to 134 percent. The reason is the substantial retrenchment of average debt among the middle class over these years. Overall debt fell by 25 percent in real terms, mortgage debt by 23 percent, and other debt by 32 percent. The fact that the debt-equity ratio rose over these years was a reflection of the steep drop in median net worth of 44 percent. Both ratios dropped from 2010 to 2013 as outstanding debt levels fell -- overall debt by 8 percent and mortgage debt by 10 percent, though other debt rose by 1.6 percent.
The overall stock ownership rate (either directly or indirectly through mutual funds, trust funds, or pension plans), after rising briskly from 32 percent in 1989 to 52 percent in 2001, fell off moderately to 49 percent in 2007 and then to 47 percent in 2010 and 46 percent in 2013. Similar time trends are evident for the share of households with $5,000 or more of stocks (in 1995 dollars) and with $10,000 or more of stocks. The fall off from 2007 to 2010 was surprisingly modest in light of the very steep decline in stock prices over those years.
However, the concentration of investment type assets generally remained as high in 2013 as during the previous two and a half decades. About 90 percent of the total value of stock shares, bonds, trusts, and business equity, and about 80 percent of non-home real estate were held by the top 10 percent of households. Stock ownership is also highly skewed by wealth and income class. The top one percent of households classified by wealth owned 38 percent of all stocks in 2013, the top 10 percent 81 percent, and the top quintile 92 percent.
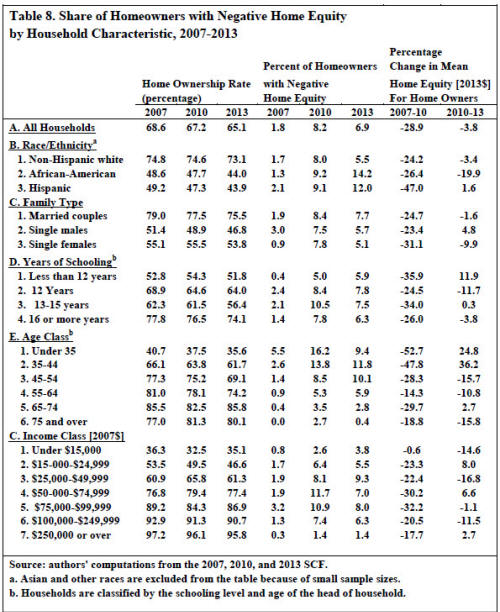
Despite the 24 percent plunge in house prices (in real terms) from 2007 to 2010, the share of home owners who were “underwater” was “only” 8.2 percent in 2010. However, average home equity among home owners did decline by 29 percent. This reduction would have been higher except for the contraction of mortgage debt noted above. Hispanics, younger households, and middle income households were hit particularly hard in terms of the loss of home equity. From 2010 to 2013, the share underwater fell to 6.9 percent as mortgage debt continued to decline and house prices recovered somewhat. Mean home equity dropped by only 3.8 percent. The decline was particularly great among black, single female, middle aged, and middle class households, while younger households recorded particularly large gains.
The one piece of mainly positive news is that among all households there was no deterioration in pension accumulations in DC-type pension plans over the Great Recession. The share of households with a DC account, after rising from 11 percent in 1983 to 53 percent in 2007, did fall off to 49 percent in 2013. However, average DC pension wealth among all households continued to grow from 2007 to 2010 and from 2010 to 2013. The main reason was a shifting of household portfolios. Pension accounts as a share of total assets, after rising from 1.5 percent in 1983 to 12.1 percent in 2007, jumped to 15.1 percent in 2010 and then to 16.5 percent in 2013. Moreover, the percent of middle class households with a defined contribution pension plan, after growing robustly from 12 percent in 1983 to 53 percent in 2007, fell off sharply to 46 percent in 2010 and then to 44 percent in 2013, and the change in dollar terms from 2007 to 2013 was -16 percent.
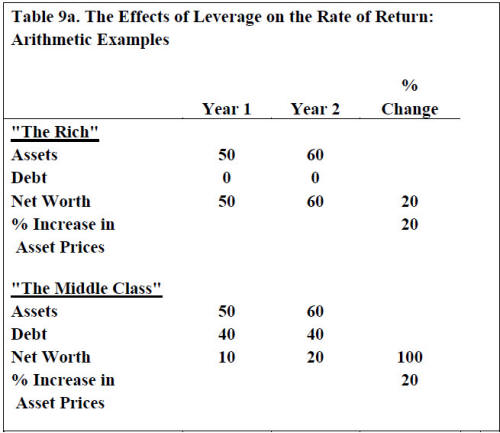
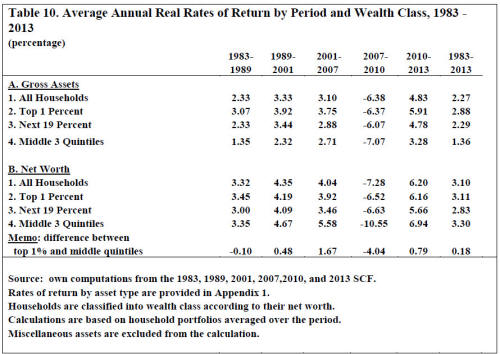
The key to understanding the plight of the middle class over the Great Recession was their high degree of leverage and the high concentration of assets in their home. The steep decline in median net worth between 2007 and 2010 was primarily due to the very high negative rate of return on net worth of the middle three wealth quintiles (-10.6 percent per year). This, in turn, was attributable to the precipitous fall in home prices and their very high degree of leverage. High leverage, moreover, helps explain why median wealth fell more than house (and stock) prices over these years and declined much more than median income.
However, this is not the whole story with regard to the collapse in median net worth from 2007 to 2010. On the basis of the rates of return computed for the middle three wealth quintiles (and assuming that all wealth classes receive the average rate of return by asset class), median wealth should have fallen by only 27 percent, instead of the actual 44 percent. If we ignore net flows of inheritances and gifts over the period,32 this discrepancy must be due to dissavings. Indeed, the results imply a substantial dissaving rate over this period, of 5.6 percent per year relative to initial wealth and 11.4 percent per year relative to initial (median) income.33
With regard to the fact that median net worth showed no improvement over years 2010 to 2013, a different explanation is called for. For the period from 2010 to 2013, the whole story is dissavings. As noted above, asset prices more than recovered from 2010 to 2013, except for housing, which was still up by 8 percent (in real terms). On the basis of rates of return computed for the three middle wealth quintiles, median net worth should have increased by 36 percent. Despite this, median wealth was down slightly over these years. It appears (once again ignoring net flows of inheritances and gifts) that substantial dissavings over this period accounts for the failure of wealth to grow over these years. In particular, the middle class must have had an annual dissavings rate of 8.1 percent relative to initial wealth and 9.9 percent relative to initial (median) income.34
The stagnation of median wealth from 2010 to 2013 can be traced to the depletion of assets. In particular, the middle class was using up its assets to pay down its debt, which decreased by 8.2 percent over these years. This shows up, in particular, in reduced asset ownership rates. The homeownership rate fell from 68.0 to 66.7 percent, that of pension accounts from 45.8 to 44.4 percent, that of unincorporated businesses from 8.2 to 6.6 percent, and that of stocks and financial securities from 15.3 to 14.2 percent. However, the reduction in assets was greater than the reduction of debt.
The likely reason for the high rate of dissavings of the middle class over both the 2007- 2010 and the 2010-2013 periods is income stagnation (actually, a reduction in median income over these years). It appears that the middle class was depleting its assets to maintain its previous level of consumption. The evidence, moreover, suggests that middle class households, experiencing stagnating incomes, expanded their debt (at least until 2007) mainly in order to finance normal consumption expenditures rather than to increase their investment portfolio.35
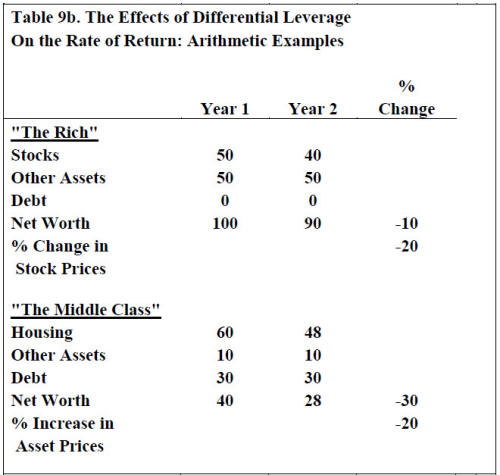
The large spread in rates of return on net worth between the middle three wealth quintiles and the top percentile (over four percentage points) also largely explains why wealth inequality advanced steeply from 2007 to 2010 despite the decline in income inequality and constancy in the ratio of stock to housing prices (both declined at about the same rate over these years). It was thus the case that the middle class took a bigger relative hit on their net worth from the decline in home prices than the top 20 percent did from the stock market plunge. This factor is also reflected in the fact that median wealth dropped much more in percentage terms than mean wealth over the Great Recession.
In contrast, there was relatively little change in wealth inequality from 2010 to 2013. This is true despite the large increase in income inequality over these years as well as a sharp rise of 29 percent in the ratio of stock to housing prices. The offsetting factor in this case was the higher rate of return on net worth of the middle class than the top one percent (a 0.79 percentage point difference).
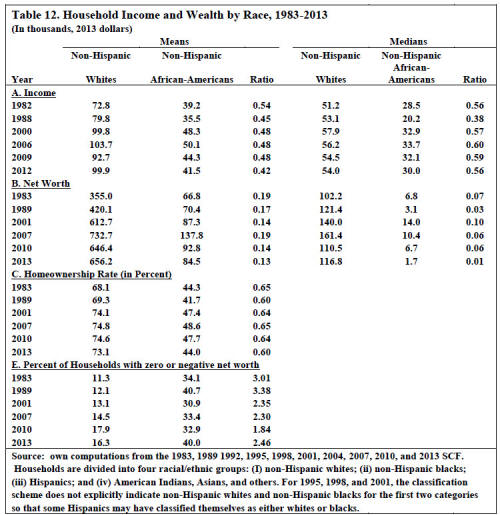
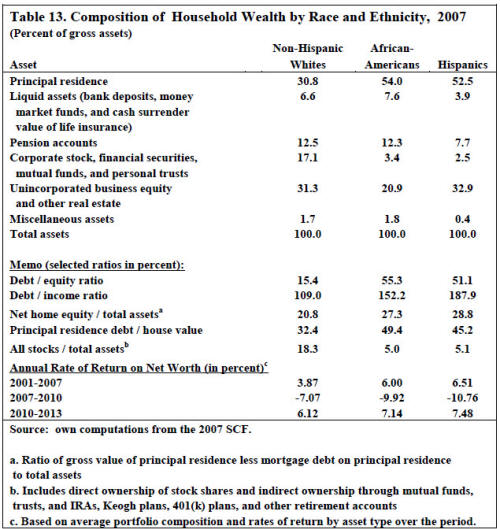
The racial disparity in wealth holdings, after fluctuating over the years from 1983 to 2007, was almost exactly the same in 2007 as in 1983. However, the Great Recession hit African-American households much harder than whites and the ratio of mean wealth between the two groups plunged from 0.19 in 2007 to 0.14 in 2010, mainly due to a 33 percent decline (in real terms) in black wealth. The relative (and absolute) losses suffered by black households from 2007 to 2010 are ascribable to the fact that blacks had a higher share of homes in their portfolio than did whites and much higher leverage than whites (debt-equity ratios of 0.55 and 0.15, respectively). These factors led to a wide discrepancy in rates of return on their respective portfolios (-9.9 versus -7.1 percent per year). From 2010 to 2013, the wealth ratio slipped from 0.14 to 0.13, despite the fact that the rate of return on the portfolio of black families was greater than that of white families (7.14 versus 6.12 percent per year). The results imply that black families had a substantially higher dissavings rate than white families.
Hispanic households made sizeable gains on (non-Hispanic) white households from 1983 to 2007. The ratio of mean net worth grew from 0.16 to 0.26, the homeownership rate among Hispanic households climbed from 33 to 49 percent, and the ratio of homeownership rates with white households advanced from 48 to 66 percent. However, in a reversal of fortunes, Hispanic households got hammered by the first half of the Great Recession. Their mean net worth plunged in half from 2007 to 2010, the ratio of mean net worth with white households fell from 0.26 to 0.15, their home ownership rate fell by 1.9 percentage points, and their net home equity plummeted by 47 percent. The relative (and absolute) losses suffered by Hispanic households over these three years are also mainly due to the much larger share of homes in their wealth portfolio and their much higher leverage rate (a debt-equity ratio of 0.51 versus 0.15). These factors led to a wide disparity in returns on their respective portfolios (-10.8 versus -7.1 percent per year). Another likely factor is that a high percentage of Hispanics bought their homes close to the housing cycle peak. From 2010 to 2013, their net worth ratio remained unchanged despite the fact that they had a higher return on their portfolio than did whites (7.5 versus 6.1 percent per year). The implication here too is that Hispanics had higher dissavings rates than did whites.
Young households also got pummeled by the Great Recession. The ratio of net worth between households under age 35 and all households, after falling from 0.21 in 1983 to 0.17 in 2007, plunged to 0.11 in 2010. In (real) dollar terms, their mean net worth declined by 46 percent from 2007 to 2010. Among age group 35-44, the ratio of their net worth to the overall figure fell from 0.71 in 1983 to 0.58 in 2007 and then declined precipitously to 0.42 in 2010. In dollar terms, their wealth fell by 39 percent over the latter three years. The same two factors explain the losses suffered by young households as for minorities – the higher share of homes in their wealth portfolio and their much higher leverage ratios. In terms of rates of return, the youngest age group had an annual return of -13.5 percent and age group 35-44 had a return of -9.6 percent compared to -7.3 percent for all households. The relative net worth of the under 35 age group did recover slightly to 0.12 in 2013 while that of age group 35-44 rebounded to 0.64. These trends mainly reflected the high annual rate of return on their wealth portfolio – 10.7 percent for the under 35 age group and 7.5 percent for age group 35-44 compared to 6.2 percent overall.
After a period of robust growth, median wealth continued to climb by 19 percent from 2001 to 2007, even faster than during the 1990s (and 1980s). Median income, on the other hand, rose only 1.6 percent. Then the Great Recession hit. From 2007 to 2010, house prices fell by 24 percent in real terms, stock prices by 26 percent, and median wealth by a staggering 44 percent. Median income also dropped but by a more modest 6.7 percent and median non-home wealth plummeted by 49 percent. The share of households with zero or negative net worth rose sharply from 18.6 to 21.8 percent.
However, from 2010 to 2013, asset prices recovered with stock prices up by 39 percent and house prices by 8 percent. Despite this, both median and mean wealth stagnated, while median income was down by 1.3 percent but mean income rose by 0.9 percent. The percent of households with zero or negative net worth remained unchanged.
Wealth inequality after remaining relatively stable from 1989 to 2007 showed a steep advance over years 2007 to 2010. The Gini coefficient climbed from 0.834 to 0.866 and the share of the top 20 percent from 85 to 89 percent. In contrast, income inequality, after rising moderately from 2000 to 2007 (an increase of 0.12 Gini points), dropped substantially from 2006 to 2009 (a decrease of 0.25 Gini points). Net worth inequality, on the other hand, remained relatively unchanged between 2010 and 2013, though the share of the top one percent was up by 1.6 percentage points. But income inequality showed a substantial rise from 2010 to 2013, with the Gini coefficient returning to its 2007 level.
Between 1983 and 2013, the top one percent received 41 percent of the total growth in net worth, 43 percent of the total growth in non-home wealth, and 49 percent of the total increase in income. The figures for the top 20 percent are 99 percent, 98 percent, and 103 percent, respectively – that is to say, the upper quintile got it all!
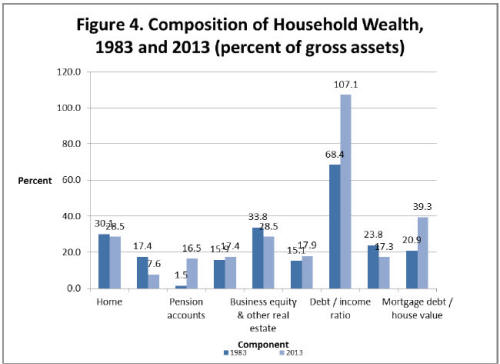
Another notable development was the sharply rising debt to income ratio during the early and mid 2000s, reaching its highest level in almost 25 years, at 119% among all households in 2007. The debt-equity ratio was also way up, from 14.3 percent in 2001 to 18.1 percent in 2007. Most of the rising debt was from increased mortgages on homes. From 2007 to 2010 both ratios continued to rise, the former moderately from 119 to 127 percent and the latter more steeply from 18.1 to 20.6 percent. This was true despite a moderate retrenchment of overall average debt of 4.4 percent and reflected the drop in both mean wealth and income. Both ratios fell off sharply by 2013, to 107 percent and 17.9 percent, respectively, as outstanding debt continued to shrink, by 13 percent in this case.
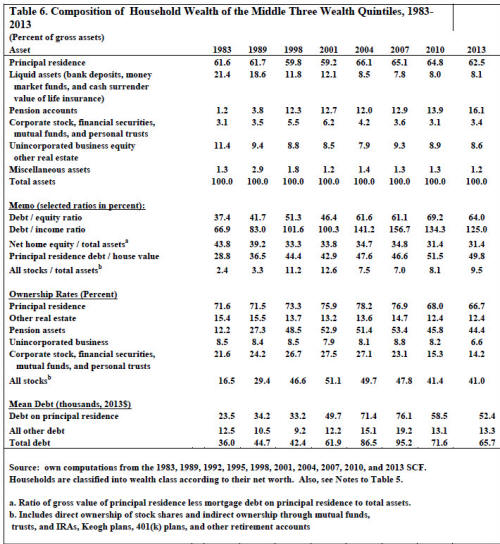
Home values as a share of total assets among all households remained relatively unchanged from 1983 to 2010 (around 30 percent). However, net equity in owner-occupied housing as a share of total assets fell from 24 percent in 1983 to 17 percent in 2010, reflecting rising mortgage debt on homeowner's property, which grew from 21 to 39 percent in 2013. The large increase in the ratio from 2007 to 2010 was a result of falling home values (average mortgage debt actually declined by 5.0 percent in constant dollars). The decline from 2010 to 2013 reflected a substantial reduction in average outstanding mortgage debt (13 percent).
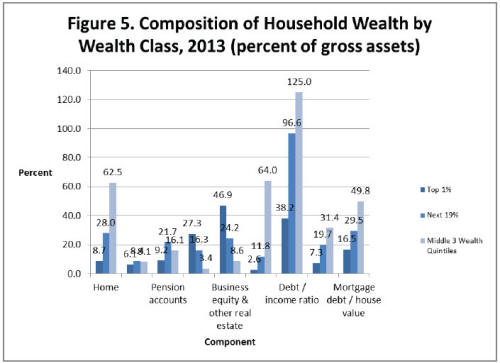
Among the middle class (defined here by the middle three wealth quintiles) there was a huge increase in the debt-income ratio from 100 to 157 percent from 2001 to 2007 and of the debt-equity ratio from 46 to 61 percent. The debt-equity ratio was also much higher among the middle 60 percent of households in 2007, at 0.61, than among the top one percent (0.028) or the next 19 percent (0.121). However, from 2007 to 2010, while the debt-equity ratio continued to advance to 69 percent, the debt to income ratio actually fell off to 134 percent. The reason is the substantial retrenchment of average debt among the middle class over these years. Overall debt fell by 25 percent in real terms, mortgage debt by 23 percent, and other debt by 32 percent. The fact that the debt-equity ratio rose over these years was a reflection of the steep drop in median net worth of 44 percent. Both ratios dropped from 2010 to 2013 as outstanding debt levels fell -- overall debt by 8 percent and mortgage debt by 10 percent, though other debt rose by 1.6 percent.
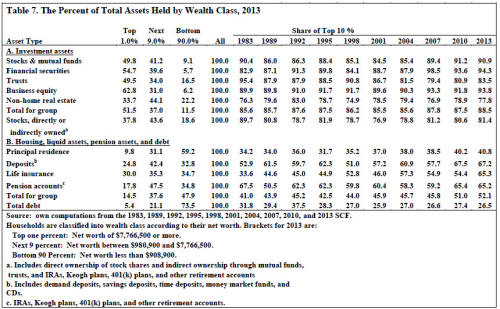
The overall stock ownership rate (either directly or indirectly through mutual funds, trust funds, or pension plans), after rising briskly from 32 percent in 1989 to 52 percent in 2001, fell off moderately to 49 percent in 2007 and then to 47 percent in 2010 and 46 percent in 2013. Similar time trends are evident for the share of households with $5,000 or more of stocks (in 1995 dollars) and with $10,000 or more of stocks. The fall off from 2007 to 2010 was surprisingly modest in light of the very steep decline in stock prices over those years.
However, the concentration of investment type assets generally remained as high in 2013 as during the previous two and a half decades. About 90 percent of the total value of stock shares, bonds, trusts, and business equity, and about 80 percent of non-home real estate were held by the top 10 percent of households. Stock ownership is also highly skewed by wealth and income class. The top one percent of households classified by wealth owned 38 percent of all stocks in 2013, the top 10 percent 81 percent, and the top quintile 92 percent.
Despite the 24 percent plunge in house prices (in real terms) from 2007 to 2010, the share of home owners who were “underwater” was “only” 8.2 percent in 2010. However, average home equity among home owners did decline by 29 percent. This reduction would have been higher except for the contraction of mortgage debt noted above. Hispanics, younger households, and middle income households were hit particularly hard in terms of the loss of home equity. From 2010 to 2013, the share underwater fell to 6.9 percent as mortgage debt continued to decline and house prices recovered somewhat. Mean home equity dropped by only 3.8 percent. The decline was particularly great among black, single female, middle aged, and middle class households, while younger households recorded particularly large gains.
The one piece of mainly positive news is that among all households there was no deterioration in pension accumulations in DC-type pension plans over the Great Recession. The share of households with a DC account, after rising from 11 percent in 1983 to 53 percent in 2007, did fall off to 49 percent in 2013. However, average DC pension wealth among all households continued to grow from 2007 to 2010 and from 2010 to 2013. The main reason was a shifting of household portfolios. Pension accounts as a share of total assets, after rising from 1.5 percent in 1983 to 12.1 percent in 2007, jumped to 15.1 percent in 2010 and then to 16.5 percent in 2013. Moreover, the percent of middle class households with a defined contribution pension plan, after growing robustly from 12 percent in 1983 to 53 percent in 2007, fell off sharply to 46 percent in 2010 and then to 44 percent in 2013, and the change in dollar terms from 2007 to 2013 was -16 percent.
The key to understanding the plight of the middle class over the Great Recession was their high degree of leverage and the high concentration of assets in their home. The steep decline in median net worth between 2007 and 2010 was primarily due to the very high negative rate of return on net worth of the middle three wealth quintiles (-10.6 percent per year). This, in turn, was attributable to the precipitous fall in home prices and their very high degree of leverage. High leverage, moreover, helps explain why median wealth fell more than house (and stock) prices over these years and declined much more than median income.
However, this is not the whole story with regard to the collapse in median net worth from 2007 to 2010. On the basis of the rates of return computed for the middle three wealth quintiles (and assuming that all wealth classes receive the average rate of return by asset class), median wealth should have fallen by only 27 percent, instead of the actual 44 percent. If we ignore net flows of inheritances and gifts over the period,32 this discrepancy must be due to dissavings. Indeed, the results imply a substantial dissaving rate over this period, of 5.6 percent per year relative to initial wealth and 11.4 percent per year relative to initial (median) income.33
With regard to the fact that median net worth showed no improvement over years 2010 to 2013, a different explanation is called for. For the period from 2010 to 2013, the whole story is dissavings. As noted above, asset prices more than recovered from 2010 to 2013, except for housing, which was still up by 8 percent (in real terms). On the basis of rates of return computed for the three middle wealth quintiles, median net worth should have increased by 36 percent. Despite this, median wealth was down slightly over these years. It appears (once again ignoring net flows of inheritances and gifts) that substantial dissavings over this period accounts for the failure of wealth to grow over these years. In particular, the middle class must have had an annual dissavings rate of 8.1 percent relative to initial wealth and 9.9 percent relative to initial (median) income.34
The stagnation of median wealth from 2010 to 2013 can be traced to the depletion of assets. In particular, the middle class was using up its assets to pay down its debt, which decreased by 8.2 percent over these years. This shows up, in particular, in reduced asset ownership rates. The homeownership rate fell from 68.0 to 66.7 percent, that of pension accounts from 45.8 to 44.4 percent, that of unincorporated businesses from 8.2 to 6.6 percent, and that of stocks and financial securities from 15.3 to 14.2 percent. However, the reduction in assets was greater than the reduction of debt.
The likely reason for the high rate of dissavings of the middle class over both the 2007- 2010 and the 2010-2013 periods is income stagnation (actually, a reduction in median income over these years). It appears that the middle class was depleting its assets to maintain its previous level of consumption. The evidence, moreover, suggests that middle class households, experiencing stagnating incomes, expanded their debt (at least until 2007) mainly in order to finance normal consumption expenditures rather than to increase their investment portfolio.35
The large spread in rates of return on net worth between the middle three wealth quintiles and the top percentile (over four percentage points) also largely explains why wealth inequality advanced steeply from 2007 to 2010 despite the decline in income inequality and constancy in the ratio of stock to housing prices (both declined at about the same rate over these years). It was thus the case that the middle class took a bigger relative hit on their net worth from the decline in home prices than the top 20 percent did from the stock market plunge. This factor is also reflected in the fact that median wealth dropped much more in percentage terms than mean wealth over the Great Recession.
In contrast, there was relatively little change in wealth inequality from 2010 to 2013. This is true despite the large increase in income inequality over these years as well as a sharp rise of 29 percent in the ratio of stock to housing prices. The offsetting factor in this case was the higher rate of return on net worth of the middle class than the top one percent (a 0.79 percentage point difference).
The racial disparity in wealth holdings, after fluctuating over the years from 1983 to 2007, was almost exactly the same in 2007 as in 1983. However, the Great Recession hit African-American households much harder than whites and the ratio of mean wealth between the two groups plunged from 0.19 in 2007 to 0.14 in 2010, mainly due to a 33 percent decline (in real terms) in black wealth. The relative (and absolute) losses suffered by black households from 2007 to 2010 are ascribable to the fact that blacks had a higher share of homes in their portfolio than did whites and much higher leverage than whites (debt-equity ratios of 0.55 and 0.15, respectively). These factors led to a wide discrepancy in rates of return on their respective portfolios (-9.9 versus -7.1 percent per year). From 2010 to 2013, the wealth ratio slipped from 0.14 to 0.13, despite the fact that the rate of return on the portfolio of black families was greater than that of white families (7.14 versus 6.12 percent per year). The results imply that black families had a substantially higher dissavings rate than white families.
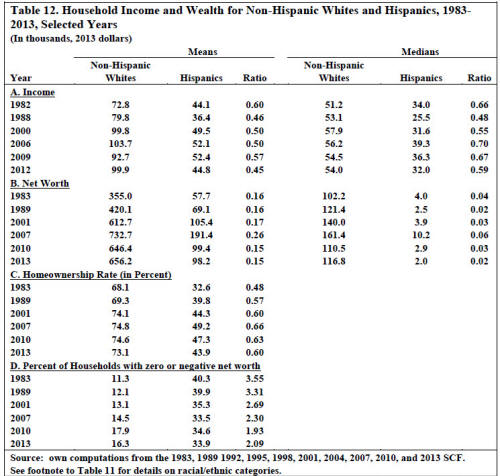
Hispanic households made sizeable gains on (non-Hispanic) white households from 1983 to 2007. The ratio of mean net worth grew from 0.16 to 0.26, the homeownership rate among Hispanic households climbed from 33 to 49 percent, and the ratio of homeownership rates with white households advanced from 48 to 66 percent. However, in a reversal of fortunes, Hispanic households got hammered by the first half of the Great Recession. Their mean net worth plunged in half from 2007 to 2010, the ratio of mean net worth with white households fell from 0.26 to 0.15, their home ownership rate fell by 1.9 percentage points, and their net home equity plummeted by 47 percent. The relative (and absolute) losses suffered by Hispanic households over these three years are also mainly due to the much larger share of homes in their wealth portfolio and their much higher leverage rate (a debt-equity ratio of 0.51 versus 0.15). These factors led to a wide disparity in returns on their respective portfolios (-10.8 versus -7.1 percent per year). Another likely factor is that a high percentage of Hispanics bought their homes close to the housing cycle peak. From 2010 to 2013, their net worth ratio remained unchanged despite the fact that they had a higher return on their portfolio than did whites (7.5 versus 6.1 percent per year). The implication here too is that Hispanics had higher dissavings rates than did whites.
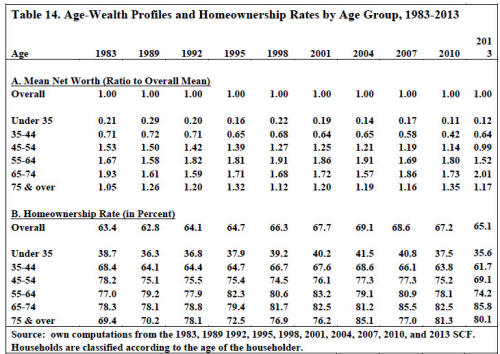
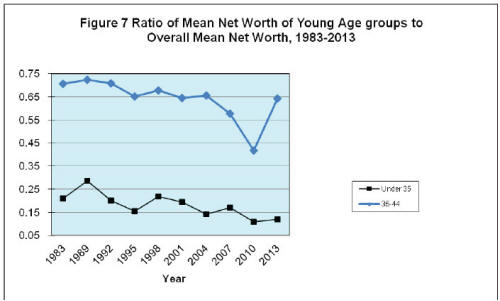
Young households also got pummeled by the Great Recession. The ratio of net worth between households under age 35 and all households, after falling from 0.21 in 1983 to 0.17 in 2007, plunged to 0.11 in 2010. In (real) dollar terms, their mean net worth declined by 46 percent from 2007 to 2010. Among age group 35-44, the ratio of their net worth to the overall figure fell from 0.71 in 1983 to 0.58 in 2007 and then declined precipitously to 0.42 in 2010. In dollar terms, their wealth fell by 39 percent over the latter three years. The same two factors explain the losses suffered by young households as for minorities – the higher share of homes in their wealth portfolio and their much higher leverage ratios. In terms of rates of return, the youngest age group had an annual return of -13.5 percent and age group 35-44 had a return of -9.6 percent compared to -7.3 percent for all households. The relative net worth of the under 35 age group did recover slightly to 0.12 in 2013 while that of age group 35-44 rebounded to 0.64. These trends mainly reflected the high annual rate of return on their wealth portfolio – 10.7 percent for the under 35 age group and 7.5 percent for age group 35-44 compared to 6.2 percent overall.